
Page 312 - Adsorption, Ion Exchange & Catalysis- 2007, Elsevier - Copy
P. 312
Else_AIEC-INGLE_cH004.qxd 7/1/2006 6:53 PM Page 308
308 4. Adsorption and Ion Exchange
1
0.9
0.8
0.7
0.6
o
0.5
C/C
0.4
0.3
0.2
0.1
0
Breakpoint Exhaustion
V eff
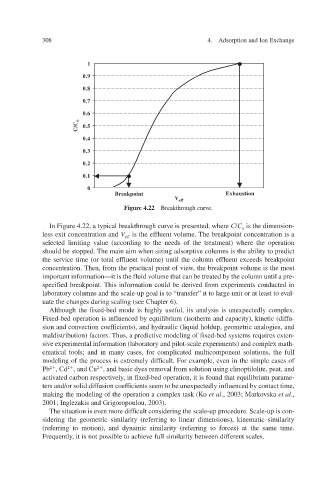
Figure 4.22 Breakthrough curv e.
In Figure 4.22, a typical breakthrough curv where e is presented, C / C is the dimension-
o
less exit concentration and V is the effluent vThe breakpoint concentration is a olume.
eff
selected limiting value (according to the needs of the treatment) where the operation
should be stopped. The main aim when sizing adsorptie columns is the ability to predict v
the service time (or total effluent volume) until the column effluent exceeds breakpoint
,
w
concentration. Then, from the practical point of vie the breakpoint volume is the most
important information—it is the fluid volume that can be treated by the column until a pre-
specified breakpoint. This information could be deried from experiments conducted in v
laboratory columns and the scale-up goal is to “transfer” it to large unit or at least to e al- v
uate the changes during scaling (see Chapter 6).
ix
Although the fed-bed mode is highly useful, its analysis is unexpectedly comple x.
Fixed-bed operation is influenced by equilibrium (isotherm and capacity), kinetic (dif fu-
v sion and con and hydraulic (liquid holdup, geometric analogies, and
icients),
ection coef
f
maldistribution) factors. Thus, a predictie modeling of fed-bed systems requires e v ix xten-
sive experimental information (laboratory and pilot-scale experiments) and complex math-
ematical tools; and in many cases, for complicated multicomponent solutions, the full
f
modeling of the process is extremely dificult. For e een in the simple cases of v
xample,
Pb 2 ,C d 2 , and Cu 2 , and basic dyes remo peat, and
al from solution using clinoptilolite,
v
ix
activated carbon respectively, in f it is found that equilibrium parame-
ed-bed operation,
ters and/or solid diffusion coefficients seem to be unexpectedly influenced by contact time,
making the modeling of the operation a complex task (K o et al ., 2003; Mark vska o et al .,
2001; Inglezakis and Grigoropoulou, 2003).
The situation is even more difficult considering the scale-up procedure. Scale-up is con-
sidering the geometric similarity (referring to linear dimensions), kinematic similarity
(referring to motion), and dynamic similarity (referring to forces) at the same time.
Frequently, it is not possible to achiee full similarity between dif ferent scales. v