
Page 371 - Advanced Organic Chemistry Part A - Structure and Mechanisms, 5th ed (2007) - Carey _ Sundberg
P. 371
352
CHAPTER 3
Structural Effects on
Stability and Reactivity
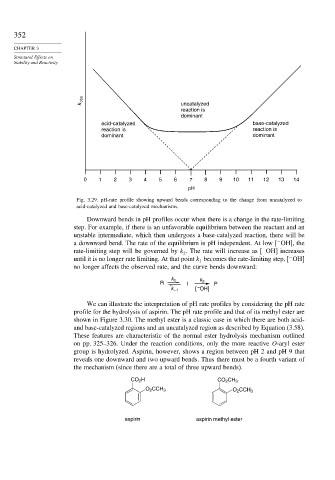
k obs uncatalyzed
reaction is
dominant
acid-catalyzed base-catalyzed
reaction is reaction is
dominant dominant
0 1 2 3 4 5 6 7 8 9 10 11 12 13 14
pH
Fig. 3.29. pH-rate profile showing upward bends corresponding to the change from uncatalyzed to
acid-catalyzed and base-catalyzed mechanisms.
Downward bends in pH profiles occur when there is a change in the rate-limiting
step. For example, if there is an unfavorable equilibrium between the reactant and an
unstable intermediate, which then undergoes a base-catalyzed reaction, there will be
−
a downward bend. The rate of the equilibrium is pH independent. At low OH , the
rate-limiting step will be governed by k . The rate will increase as OH increases
−
2
until it is no longer rate limiting. At that point k becomes the rate-limiting step, OH
−
1
no longer affects the observed rate, and the curve bends downward:
k k
R 1 I 2 P
–
k –1 [ OH]
We can illustrate the interpretation of pH rate profiles by considering the pH rate
profile for the hydrolysis of aspirin. The pH rate profile and that of its methyl ester are
shown in Figure 3.30. The methyl ester is a classic case in which there are both acid-
and base-catalyzed regions and an uncatalyzed region as described by Equation (3.58).
These features are characteristic of the normal ester hydrolysis mechanism outlined
on pp. 325–326. Under the reaction conditions, only the more reactive O-aryl ester
group is hydrolyzed. Aspirin, however, shows a region between pH 2 and pH 9 that
reveals one downward and two upward bends. Thus there must be a fourth variant of
the mechanism (since there are a total of three upward bends).
CO 2 H CO 2 CH 3
O 2 CCH 3 O 2 CCH 3
aspirin aspirin methyl ester