
Page 370 - Advanced Organic Chemistry Part A - Structure and Mechanisms, 5th ed (2007) - Carey _ Sundberg
P. 370
(a) (b) (c) 351
log k(obs) log k(obs) log k(obs) SECTION 3.7
Catalysis
pH pH pH
(d) (e) (f)
log k(obs) log k(obs) log k(obs)
pH pH pH
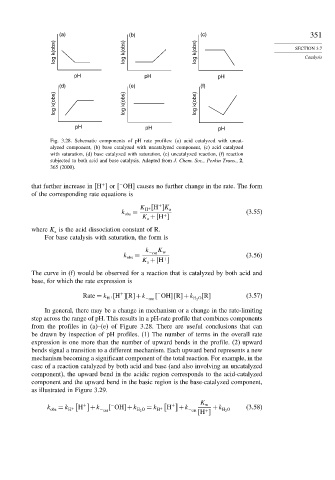
Fig. 3.28. Schematic components of pH rate profiles: (a) acid catalyzed with uncat-
alyzed component, (b) base catalyzed with uncatalyzed component, (c) acid catalyzed
with saturation, (d) base catalyzed with saturation, (e) uncatalyzed reaction, (f) reaction
subjected to both acid and base catalysis. Adapted from J. Chem. Soc., Perkin Trans., 2,
365 (2000).
that further increase in H or OH causes no further change in the rate. The form
+
−
of the corresponding rate equations is
K + H K a
+
H
k obs = (3.55)
K + H
+
a
where K is the acid dissociation constant of R.
a
For base catalysis with saturation, the form is
k K w
k obs = − OH (3.56)
K + H
+
a
The curve in (f) would be observed for a reaction that is catalyzed by both acid and
base, for which the rate expression is
+
−
Rate = k + H R +k − OH OH R +k H 2 O R (3.57)
H
In general, there may be a change in mechanism or a change in the rate-limiting
step across the range of pH. This results in a pH-rate profile that combines components
from the profiles in (a)–(e) of Figure 3.28. There are useful conclusions that can
be drawn by inspection of pH profiles. (1) The number of terms in the overall rate
expression is one more than the number of upward bends in the profile. (2) upward
bends signal a transition to a different mechanism. Each upward bend represents a new
mechanism becoming a significant component of the total reaction. For example, in the
case of a reaction catalyzed by both acid and base (and also involving an uncatalyzed
component), the upward bend in the acidic region corresponds to the acid-catalyzed
component and the upward bend in the basic region is the base-catalyzed component,
as illustrated in Figure 3.29.
K
+ − + w
k obs = k + H +k OH +k H 2 O = k + H +k +k H 2 O (3.58)
H
H
− OH
− OH
H
+