
Page 295 - Advances in Biomechanics and Tissue Regeneration
P. 295
15.2 METHODOLOGY 293
FIG. 15.4 Schematic illustration of the cell deformation resulting from the sensing
force in the cell mechanosensing stage. N i is a point on the surface of the undeformed
cell (solid line), n i is the same point on the surface of the deformed cell (dashed line), and
C is the cell center.
F trac ¼ σ cell (15.5)
i i Skn r ψe i
where S stands for a proportionality model parameter with units of area. k is the binding constant for the integrins at
the front and rear of the cell to the ligands in the ECM and n r is the total number of available receptors at the front and
rear of the cell. Finally, ψ represents the concentration of the ligands at the leading edge of the cell in the ECM [27].
net
Therefore, The resultant traction force, F trac , can be calculated by the summation of the traction forces applied at each
node as
n
X
F net ¼ F trac (15.6)
i
trac
i¼1
where n is the number of the nodes located on the cell surface.
In a multicellular system, cells deform when they contact each other to occupy all the ECM [72, 100]. Therefore,
when cell migration is considered with a constant cell shape, to avoid interference of two cells it is assumed that
k r j r i k 2r (15.7)
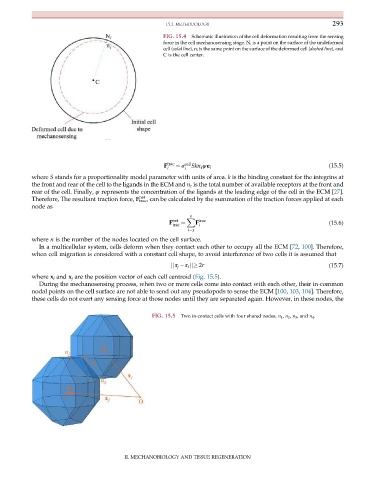
where x i and x j are the position vector of each cell centroid (Fig. 15.5).
During the mechanosensing process, when two or more cells come into contact with each other, their in-common
nodal points on the cell surface are not able to send out any pseudopods to sense the ECM [100, 103, 104]. Therefore,
these cells do not exert any sensing force at those nodes until they are separated again. However, in these nodes, the
FIG. 15.5 Two in-contact cells with four shared nodes, n 1 , n 2 , n 3 , and n 4 .
II. MECHANOBIOLOGY AND TISSUE REGENERATION