
Page 298 - Advances in Biomechanics and Tissue Regeneration
P. 298
296 15. COMPUTATIONAL SIMULATION OF CELL BEHAVIOR FOR TISSUE REGENERATION
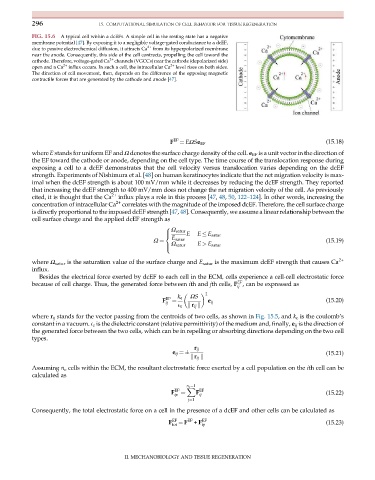
FIG. 15.6 A typical cell within a dcEFs. A simple cell in the resting state has a negative
membrane potential [47]. By exposing it to a negligible voltage-gated conductance to a dcEF,
due to passive electrochemical diffusion, it attracts Ca 2+ from its hyperpolarized membrane
near the anode. Consequently, this side of the cell contracts, propelling the cell toward the
cathode. Therefore, voltage-gated Ca 2+ channels (VGCCs) near the cathode (depolarized side)
open and a Ca 2+ influx occurs. In such a cell, the intracellular Ca 2+ level rises on both sides.
The direction of cell movement, then, depends on the difference of the opposing magnetic
contractile forces that are generated by the cathode and anode [47].
F EF ¼ EΩSe EF (15.18)
where E stands for uniform EF and Ω denotes the surface charge density of the cell. e EF is a unit vector in the direction of
the EF toward the cathode or anode, depending on the cell type. The time course of the translocation response during
exposing a cell to a dcEF demonstrates that the cell velocity versus translocation varies depending on the dcEF
strength. Experiments of Nishimura et al. [48] on human keratinocytes indicate that the net migration velocity is max-
imal when the dcEF strength is about 100 mV/mm while it decreases by reducing the dcEF strength. They reported
that increasing the dcEF strength to 400 mV/mm does not change the net migration velocity of the cell. As previously
cited, it is thought that the Ca 2+ influx plays a role in this process [47, 48, 50, 122–124]. In other words, increasing the
concentration of intracellular Ca 2+ correlates with the magnitude of the imposed dcEF. Therefore, the cell surface charge
is directly proportional to the imposed dcEF strength [47, 48]. Consequently, we assume a linear relationship between the
cell surface charge and the applied dcEF strength as
8
Ω satur
> E E E satur
<
E satur
Ω ¼ (15.19)
Ω satur E > E satur
>
:
where Ω satur is the saturation value of the surface charge and E satur is the maximum dcEF strength that causes Ca 2+
influx.
Besides the electrical force exerted by dcEF to each cell in the ECM, cells experience a cell-cell electrostatic force
EF
because of cell charge. Thus, the generated force between ith and jth cells, F , can be expressed as
ij
2
ΩS
k e
F EF ¼ e ij (15.20)
ij
E r k r ij k
where r ij stands for the vector passing from the centroids of two cells, as shown in Fig. 15.5, and k e is the coulomb’s
constant in a vacuum. E r is the dielectric constant (relative permittivity) of the medium and, finally, e ij is the direction of
the generated force between the two cells, which can be in repelling or absorbing directions depending on the two cell
types.
r ij
(15.21)
e ij ¼
k r ij k
Assuming n c cells within the ECM, the resultant electrostatic force exerted by a cell population on the ith cell can be
calculated as
n c 1
X
F EF F EF (15.22)
ip ¼ ij
j¼1
Consequently, the total electrostatic force on a cell in the presence of a dcEF and other cells can be calculated as
F EF ¼ F EF + F EF (15.23)
tot ip
II. MECHANOBIOLOGY AND TISSUE REGENERATION