
Page 303 - Advances in Biomechanics and Tissue Regeneration
P. 303
15.3 NUMERICAL IMPLEMENTATION AND APPLICATIONS 301
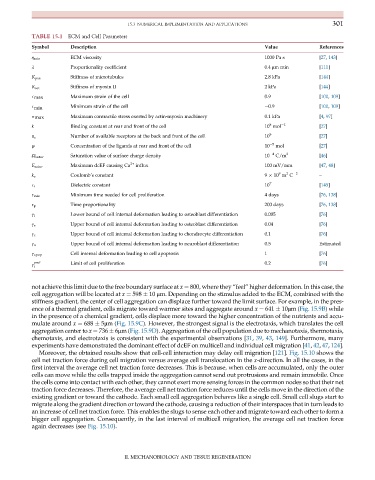
TABLE 15.1 ECM and Cell Parameters
Symbol Description Value References
η min ECM viscosity 1000 Pa s [27, 143]
λ Proportionality coefficient 0.4 μm min [111]
K pas Stiffness of microtubules 2.8 kPa [144]
K act Stiffness of myosin II 2 kPa [144]
E max Maximum strain of the cell 0.9 [100, 109]
E min Minimum strain of the cell 0.9 [100, 109]
σ max Maximum contractile stress exerted by actin-myosin machinery 0.1 kPa [4, 97]
8
k Binding constant at rear and front of the cell 10 mol 1 [27]
Number of available receptors at the back and front of the cell 10 5 [27]
n r
ψ Concentration of the ligands at rear and front of the cell 10 5 mol [27]
Saturation value of surface charge density 10 4 C/m 2 [46]
Ω satur
E satur Maximum dcEF causing Ca 2+ influx 100 mV/mm [47, 48]
9
2
k e Coulomb’s constant 9 10 m C 2 –
E r Dielectric constant 10 7 [145]
τ min Minimum time needed for cell proliferation 4 days [76, 138]
τ p Time proportionality 200 days [76, 138]
γ l Lower bound of cell internal deformation leading to osteoblast differentiation 0.005 [76]
γ s Upper bound of cell internal deformation leading to osteoblast differentiation 0.04 [76]
γ c Upper bound of cell internal deformation leading to chondrocyte differentiation 0.1 [76]
γ u Upper bound of cell internal deformation leading to neuroblast differentiation 0.5 Estimated
Cell internal deformation leading to cell apoptosis 1 [76]
γ apop
γ prof Limit of cell proliferation 0.2 [76]
i
not achieve this limit due to the free boundary surface at x ¼ 800, where they “feel” higher deformation. In this case, the
cell aggregation will be located at x ¼ 598 10 μm. Depending on the stimulus added to the ECM, combined with the
stiffness gradient, the center of cell aggregation can displace further toward the limit surface. For example, in the pres-
ence of a thermal gradient, cells migrate toward warmer sites and aggregate around x ¼ 641 10μm(Fig. 15.9B) while
in the presence of a chemical gradient, cells displace more toward the higher concentration of the nutrients and accu-
mulate around x ¼ 688 5μm(Fig. 15.9C). However, the strongest signal is the electrotaxis, which translates the cell
aggregation center to x ¼ 736 6μm(Fig. 15.9D). Aggregation of the cell population due to mechanotaxis, thermotaxis,
chemotaxis, and electrotaxis is consistent with the experimental observations [31, 39, 43, 149]. Furthermore, many
experiments have demonstrated the dominant effect of dcEF on multicell and individual cell migration [41, 42, 47, 124].
Moreover, the obtained results show that cell-cell interaction may delay cell migration [121]. Fig. 15.10 shows the
cell net traction force during cell migration versus average cell translocation in the x-direction. In all the cases, in the
first interval the average cell net traction force decreases. This is because, when cells are accumulated, only the outer
cells can move while the cells trapped inside the aggregation cannot send out protrusions and remain immobile. Once
the cells come into contact with each other, they cannot exert more sensing forces in the common nodes so that their net
traction force decreases. Therefore, the average cell net traction force reduces until the cells move in the direction of the
existing gradient or toward the cathode. Each small cell aggregation behaves like a single cell. Small cell slugs start to
migrate along the gradient direction or toward the cathode, causing a reduction of their interspaces that in turn leads to
an increase of cell net traction force. This enables the slugs to sense each other and migrate toward each other to form a
bigger cell aggregation. Consequently, in the last interval of multicell migration, the average cell net traction force
again decreases (see Fig. 15.10).
II. MECHANOBIOLOGY AND TISSUE REGENERATION