
Page 308 - Advances in Biomechanics and Tissue Regeneration
P. 308
306 15. COMPUTATIONAL SIMULATION OF CELL BEHAVIOR FOR TISSUE REGENERATION
0.4 1.5 0.5 1.5
1.4 0.4 1.4
0.3
1.3 0.3 1.3
e elong 0.2 CMI e elong CMI
1.2 0.2 1.2
0.1
Computational values 1.1 0.1 Computational values 1.1
Fitted curves Fitted curves
0 1 0 1
0 50 100 150 200 250 300 350 400 0 50 100 150 200 250 300 350 400
(A) Cell centroid translocation [µm] (B) Cell centroid translocation [µm]
0.5 1.6 0.7 1.8
0.6 1.7
1.5
0.4
0.5 1.6
1.4 1.4
1.5
e elong 0.3 1.3 CMI e elong 0.4 1.4 CMI
0.2 0.3 1.3
1.2
0.2
1.2
0.1 Computational values 1.1 Computational values
Fitted curves 0.1 Fitted curves 1.1
0 1 0 1
0 50 100 150 200 250 300 350 400 0 50 100 150 200 250 300 350 400
(C) Cell centroid translocation [µm] (D) Cell centroid translocation [µm]
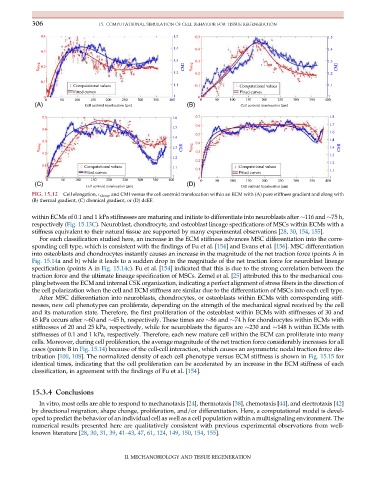
FIG. 15.12 Cell elongation, E elong , and CMI versus the cell centroid translocation within an ECM with (A) pure stiffness gradient and along with
(B) thermal gradient, (C) chemical gradient, or (D) dcEF.
within ECMs of 0.1 and 1 kPa stiffnesses are maturing and initiate to differentiate into neuroblasts after 116 and 75 h,
respectively (Fig. 15.13C). Neuroblast, chondrocyte, and osteoblast lineage specifications of MSCs within ECMs with a
stiffness equivalent to their natural tissue are supported by many experimental observations [28, 30, 154, 155].
For each classification studied here, an increase in the ECM stiffness advances MSC differentiation into the corre-
sponding cell type, which is consistent with the findings of Fu et al. [154] and Evans et al. [156]. MSC differentiation
into osteoblasts and chondrocytes instantly causes an increase in the magnitude of the net traction force (points A in
Fig. 15.14a and b) while it leads to a sudden drop in the magnitude of the net traction force for neuroblast lineage
specification (points A in Fig. 15.14c). Fu et al. [154] indicated that this is due to the strong correlation between the
traction force and the ultimate lineage specification of MSCs. Zemel et al. [25] attributed this to the mechanical cou-
pling between the ECM and internal CSK organization, indicating a perfect alignment of stress fibers in the direction of
the cell polarization when the cell and ECM stiffness are similar due to the differentiation of MSCs into each cell type.
After MSC differentiation into neuroblasts, chondrocytes, or osteoblasts within ECMs with corresponding stiff-
nesses, new cell phenotypes can proliferate, depending on the strength of the mechanical signal received by the cell
and its maturation state. Therefore, the first proliferation of the osteoblast within ECMs with stiffnesses of 30 and
45 kPa occurs after 60 and 45 h, respectively. These times are 86 and 74 h for chondrocytes within ECMs with
stiffnesses of 20 and 25 kPa, respectively, while for neuroblasts the figures are 230 and 148 h within ECMs with
stiffnesses of 0.1 and 1 kPa, respectively. Therefore, each new mature cell within the ECM can proliferate into many
cells. Moreover, during cell proliferation, the average magnitude of the net traction force considerably increases for all
cases (points B in Fig. 15.14) because of the cell-cell interaction, which causes an asymmetric nodal traction force dis-
tribution [100, 108]. The normalized density of each cell phenotype versus ECM stiffness is shown in Fig. 15.15 for
identical times, indicating that the cell proliferation can be accelerated by an increase in the ECM stiffness of each
classification, in agreement with the findings of Fu et al. [154].
15.3.4 Conclusions
In vitro, most cells are able to respond to mechanotaxis [24], thermotaxis [38], chemotaxis [44], and electrotaxis [42]
by directional migration, shape change, proliferation, and/or differentiation. Here, a computational model is devel-
oped to predict the behavior of an individual cell as well as a cell population within a multisignaling environment. The
numerical results presented here are qualitatively consistent with previous experimental observations from well-
known literature [28, 30, 31, 39, 41–43, 47, 61, 124, 149, 150, 154, 155].
II. MECHANOBIOLOGY AND TISSUE REGENERATION