Page 309 - Advances in Biomechanics and Tissue Regeneration
P. 309

15.3 NUMERICAL IMPLEMENTATION AND APPLICATIONS                    307

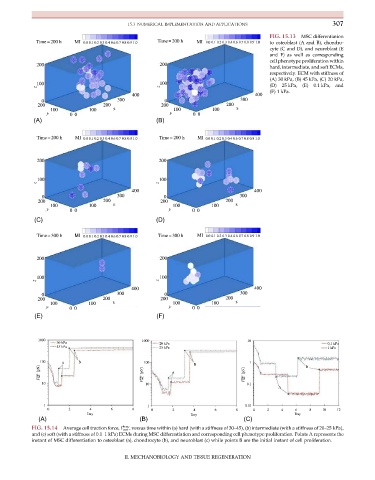
                                                                                         FIG. 15.13  MSC differentiation
             Time=200 h  MI 0.0 0.1 0.2 0.3 0.4 0.6 0.7 0.8 0.9 1.0  Time=200 h  MI  0.0 0.1 0.2 0.3 0.4 0.6 0.7 0.8 0.9 1.0  to osteoblast (A and B), chondro-
                                                                                         cyte (C and D), and neuroblast (E
                                                                                         and F) as well as corresponding
                                                                                         cell phenotype proliferation within
             200                                     200
                                                                                         hard, intermediate, and soft ECMs,
                                                                                         respectively. ECM with stiffness of
                                                                                         (A) 30 kPa, (B) 45 kPa, (C) 20 kPa,
             100                                     100
             z                                       z                                   (D)  25 kPa,  (E)  0.1 kPa,  and
                                                                                         (F) 1 kPa.
                                            400                                     400
               0                       300             0                       300
             200                   200                200                  200
                 100          100     x                   100         100     x
                y                                       y
                        0 0                                     0 0
            (A)                                     (B)
             Time=200 h  MI  0.0 0.1 0.2 0.3 0.4 0.6 0.7 0.8 0.9 1.0  Time=200 h  MI  0.0 0.1 0.2 0.3 0.4 0.6 0.7 0.8 0.9 1.0


             200                                     200


             100                                     100
             z                                       z
                                            400                                     400
               0                       300            0                        300
             200                   200               200                   200
                 100          100     x                  100          100     x
                y                                       y
                        0 0                                     0 0
            (C)                                     (D)

             Time=300 h  MI  0.0 0.1 0.2 0.3 0.4 0.6 0.7 0.8 0.9 1.0  Time=300 h  MI  0.0 0.1 0.2 0.3 0.4 0.6 0.7 0.8 0.9 1.0


             200                                     200


             100                                     100
             z                                       z
                                            400                                     400
               0                       300             0                       300
             200                   200               200                   200
                 100          100     x                  100          100     x
                y       0 0                             y       0 0
            (E)                                     (F)


             1000                              1000                               10
                   30 kPa                            20 kPa                                                 0,1 kPa
                   45 kPa                            25 kPa                                                 1 kPa
              100    A     B                    100             B                 1
              [pN]                             [pN]      A                       [pN]                B
              F trac  net                      F trac  net                       F trac  net
               10                               10                               0.1
                                                                                            A

               1                                 1                               0.01
                 0     2      4      6      8     0      2      4      6      8    0    2    4   6    8   10   12
                             Day                               Day                               Day
              (A)                              (B)                              (C)
                                         trac
           FIG. 15.14  Average cell traction force, F net , versus time within (a) hard (with a stiffness of 30–45), (b) intermediate (with a stiffness of 20–25 kPa),
           and (c) soft (with a stiffness of 0.1–1 kPa) ECMs during MSC differentiation and corresponding cell phenotype proliferation. Points A represents the
           instant of MSC differentiation to osteoblast (a), chondrocyte (b), and neuroblast (c) while points B are the initial instant of cell proliferation.


                                          II. MECHANOBIOLOGY AND TISSUE REGENERATION
   304   305   306   307   308   309   310   311   312   313   314