
Page 306 - Advances in Biomechanics and Tissue Regeneration
P. 306
304 15. COMPUTATIONAL SIMULATION OF CELL BEHAVIOR FOR TISSUE REGENERATION
1000 1000
Computation values Computation values
Fitted curve 800 Fitted curve
Average cells net traction force [pN] 600 Average cells net traction force [pN] 600
800
400
400
200
0 200 0
0 100 200 300 400 500 600 700 0 100 200 300 400 500 600
(A) Average cells translocation [µm] (B) Average cells translocation [µm]
1200 1200
Computation values m ch = 0.3 Computational values E=10 mV/mm
Computational values E=100 mV/mm
Average cells net traction force [pN] 800 Average cells net traction force [pN] 800
Computation values m ch = 0.4
Fitted curve E=10 mV/mm
1000
1000
Fitted curve E=100 mV/mm
Fitted curve m ch =0.3
Fitted curve m ch =0.4
600
600
400
400
200
0 200 0
0 100 200 300 400 500 600 700 0 100 200 300 400 500 600 700
Average cells translocation [µm] Average cells translocation [µm]
(C) (D)
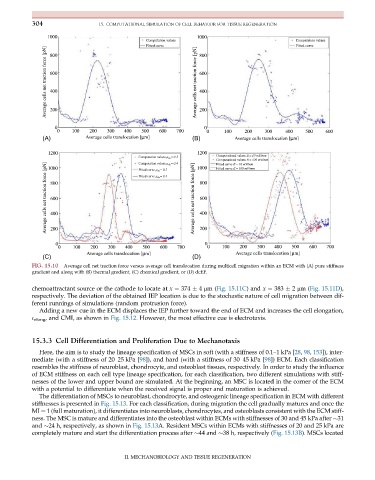
FIG. 15.10 Average cell net traction force versus average cell translocation during multicell migration within an ECM with (A) pure stiffness
gradient and along with (B) thermal gradient, (C) chemical gradient, or (D) dcEF.
chemoattractant source or the cathode to locate at x ¼ 374 4 μm(Fig. 15.11C) and x ¼ 383 2 μm(Fig. 15.11D),
respectively. The deviation of the obtained IEP location is due to the stochastic nature of cell migration between dif-
ferent runnings of simulations (random protrusion force).
Adding a new cue in the ECM displaces the IEP further toward the end of ECM and increases the cell elongation,
E elong , and CMI, as shown in Fig. 15.12. However, the most effective cue is electrotaxis.
15.3.3 Cell Differentiation and Proliferation Due to Mechanotaxis
Here, the aim is to study the lineage specification of MSCs in soft (with a stiffness of 0.1–1 kPa [28, 98, 153]), inter-
mediate (with a stiffness of 20–25 kPa [98]), and hard (with a stiffness of 30–45 kPa [98]) ECM. Each classification
resembles the stiffness of neuroblast, chondrocyte, and osteoblast tissues, respectively. In order to study the influence
of ECM stiffness on each cell type lineage specification, for each classification, two different simulations with stiff-
nesses of the lower and upper bound are simulated. At the beginning, an MSC is located in the corner of the ECM
with a potential to differentiate when the received signal is proper and maturation is achieved.
The differentiation of MSCs to neuroblast, chondrocyte, and osteogenic lineage specification in ECM with different
stiffnesses is presented in Fig. 15.13. For each classification, during migration the cell gradually matures and once the
MI ¼ 1 (full maturation), it differentiates into neuroblasts, chondrocytes, and osteoblasts consistent with the ECM stiff-
ness. The MSC is mature and differentiates into the osteoblast within ECMs with stiffnesses of 30 and 45 kPa after 31
and 24 h, respectively, as shown in Fig. 15.13A. Resident MSCs within ECMs with stiffnesses of 20 and 25 kPa are
completely mature and start the differentiation process after 44 and 38 h, respectively (Fig. 15.13B). MSCs located
II. MECHANOBIOLOGY AND TISSUE REGENERATION