
Page 411 - Advances in Biomechanics and Tissue Regeneration
P. 411
21.3 BONE REMODELING AFTER THA 409
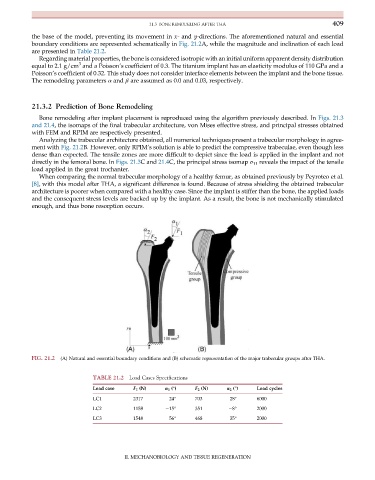
the base of the model, preventing its movement in x- and y-directions. The aforementioned natural and essential
boundary conditions are represented schematically in Fig. 21.2A, while the magnitude and inclination of each load
are presented in Table 21.2.
Regarding material properties, the bone is considered isotropic with an initial uniform apparent density distribution
3
equal to 2.1 g/cm and a Poisson’s coefficient of 0.3. The titanium implant has an elasticity modulus of 110 GPa and a
Poisson’s coefficient of 0.32. This study does not consider interface elements between the implant and the bone tissue.
The remodeling parameters α and β are assumed as 0.0 and 0.03, respectively.
21.3.2 Prediction of Bone Remodeling
Bone remodeling after implant placement is reproduced using the algorithm previously described. In Figs. 21.3
and 21.4, the isomaps of the final trabecular architecture, von Mises effective stress, and principal stresses obtained
with FEM and RPIM are respectively presented.
Analyzing the trabecular architecture obtained, all numerical techniques present a trabecular morphology in agree-
ment with Fig. 21.2B. However, only RPIM’s solution is able to predict the compressive trabeculae, even though less
dense than expected. The tensile zones are more difficult to depict since the load is applied in the implant and not
directly in the femoral bone. In Figs. 21.3C and 21.4C, the principal stress isomap σ 11 reveals the impact of the tensile
load applied in the great trochanter.
When comparing the normal trabecular morphology of a healthy femur, as obtained previously by Peyroteo et al.
[8], with this model after THA, a significant difference is found. Because of stress shielding the obtained trabecular
architecture is poorer when compared with a healthy case. Since the implant is stiffer than the bone, the applied loads
and the consequent stress levels are backed up by the implant. As a result, the bone is not mechanically stimulated
enough, and thus bone resorption occurs.
FIG. 21.2 (A) Natural and essential boundary conditions and (B) schematic representation of the major trabecular groups after THA.
TABLE 21.2 Load Cases Specifications
Load case F 1 (N) α 1 (°) F 2 (N) α 2 (°) Load cycles
LC1 2317 24° 703 28° 6000
LC2 1158 15° 351 8° 2000
LC3 1548 56° 468 35° 2000
II. MECHANOBIOLOGY AND TISSUE REGENERATION