
Page 412 - Advances in Biomechanics and Tissue Regeneration
P. 412
410 21. NUMERICAL ASSESSMENT OF BONE TISSUE REMODELING
To analyze, with more detail, the spatial apparent density variation throughout the numerical model, the isomap
was divided into the seven Gruen zones. The Gruen zones provide a reference system based on the anatomy of the
femur. This division system is usually used to visualize the zones of interest of the X-ray and thence to evaluate the
outcome of the surgical intervention. Thus the numerical model was divided as shown in Fig. 21.5A. In zone 1, known
as a zone of high resorption, only a small group of trabeculae is formed as result of the tensile load applied in the great
trochanter. On the opposite side of the model, in zone 7, FEM predicts a severe bone loss, while RPIM’s solution pre-
sents higher apparent density levels. Then, it is possible to conclude that, unlike FEM’s solution, RPIM can predict the
compressive group specified in Fig. 21.2B. The compressive group is also depicted in zone 6. For the other zones, both
numerical solutions agree. Since a greater resorption occurs in the proximal-medial zone of the femur, a distal redis-
tribution of the load is expected [20]. Therefore, as observed in Fig. 21.5A, zones 2 and 5 are zones of medium resorp-
tion, whereas in zones 3 and 4, distal bone hypertrophy is observed. This load’s redistribution is depicted in the von
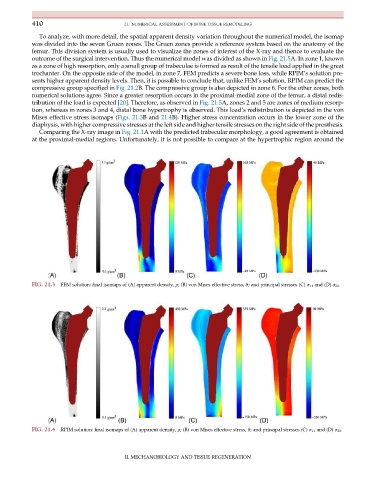
Mises effective stress isomaps (Figs. 21.3B and 21.4B). Higher stress concentration occurs in the lower zone of the
diaphysis, with higher compressive stresses at the left side and higher tensile stresses on the right side of the prosthesis.
Comparing the X-ray image in Fig. 21.1A with the predicted trabecular morphology, a good agreement is obtained
at the proximal-medial regions. Unfortunately, it is not possible to compare at the hypertrophic region around the
FIG. 21.3 FEM solution: final isomaps of (A) apparent density, ρ; (B) von Mises effective stress, σ; and principal stresses (C) σ 11 and (D) σ 22 .
FIG. 21.4 RPIM solution: final isomaps of (A) apparent density, ρ; (B) von Mises effective stress, σ; and principal stresses (C) σ 11 and (D) σ 22 .
II. MECHANOBIOLOGY AND TISSUE REGENERATION