
Page 164 - Advances in Renewable Energies and Power Technologies
P. 164
2. PV System Under Nonshading Conditions 137
600
500
400
PPV 300
200
100
0
0 100 200 300 400 500 600
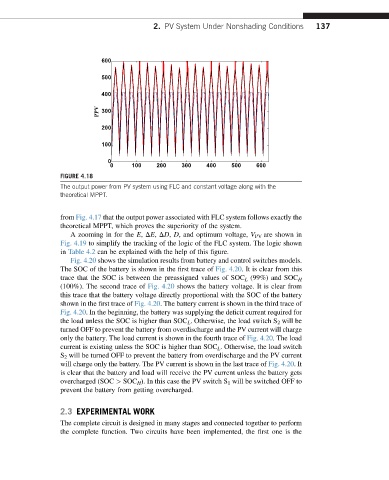
FIGURE 4.18
The output power from PV system using FLC and constant voltage along with the
theoretical MPPT.
from Fig. 4.17 that the output power associated with FLC system follows exactly the
theoretical MPPT, which proves the superiority of the system.
A zooming in for the E, DE, DD, D, and optimum voltage, V PV are shown in
Fig. 4.19 to simplify the tracking of the logic of the FLC system. The logic shown
in Table 4.2 can be explained with the help of this figure.
Fig. 4.20 shows the simulation results from battery and control switches models.
The SOC of the battery is shown in the first trace of Fig. 4.20. It is clear from this
trace that the SOC is between the preassigned values of SOC L (99%) and SOC H
(100%). The second trace of Fig. 4.20 shows the battery voltage. It is clear from
this trace that the battery voltage directly proportional with the SOC of the battery
shown in the first trace of Fig. 4.20. The battery current is shown in the third trace of
Fig. 4.20. In the beginning, the battery was supplying the deficit current required for
the load unless the SOC is higher than SOC L . Otherwise, the load switch S 2 will be
turned OFF to prevent the battery from overdischarge and the PV current will charge
only the battery. The load current is shown in the fourth trace of Fig. 4.20. The load
current is existing unless the SOC is higher than SOC L . Otherwise, the load switch
S 2 will be turned OFF to prevent the battery from overdischarge and the PV current
will charge only the battery. The PV current is shown in the last trace of Fig. 4.20.It
is clear that the battery and load will receive the PV current unless the battery gets
overcharged (SOC > SOC H ). In this case the PV switch S 1 will be switched OFF to
prevent the battery from getting overcharged.
2.3 EXPERIMENTAL WORK
The complete circuit is designed in many stages and connected together to perform
the complete function. Two circuits have been implemented, the first one is the