
Page 163 - Advances in Renewable Energies and Power Technologies
P. 163
136 CHAPTER 4 Performance of MPPT Techniques of Photovoltaic Systems
1
G 0.5
0
0 100 200 300 400 500 600
500
PPV
0
0 100 200 300 400 500 600
40
35
Vopt 30
25
0 100 200 300 400 500 600
0.01
0
-0.01
0 100 200 300 400 500 600
0.6
Duty 0.55
0.5
0 100 200 300 400 500 600
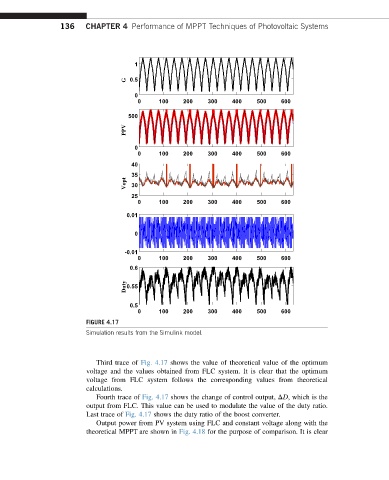
FIGURE 4.17
Simulation results from the Simulink model.
Third trace of Fig. 4.17 shows the value of theoretical value of the optimum
voltage and the values obtained from FLC system. It is clear that the optimum
voltage from FLC system follows the corresponding values from theoretical
calculations.
Fourth trace of Fig. 4.17 shows the change of control output, DD, which is the
output from FLC. This value can be used to modulate the value of the duty ratio.
Last trace of Fig. 4.17 shows the duty ratio of the boost converter.
Output power from PV system using FLC and constant voltage along with the
theoretical MPPT are shown in Fig. 4.18 for the purpose of comparison. It is clear