
Page 162 - Advances in Renewable Energies and Power Technologies
P. 162
2. PV System Under Nonshading Conditions 135
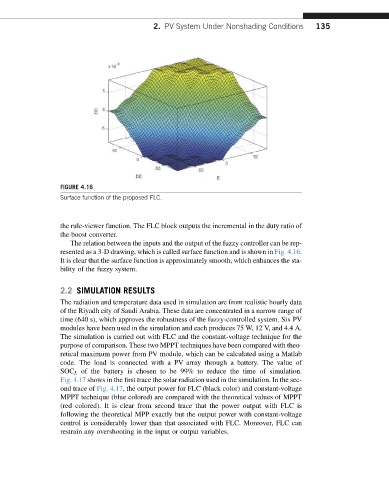
FIGURE 4.16
Surface function of the proposed FLC.
the rule-viewer function. The FLC block outputs the incremental in the duty ratio of
the boost converter.
The relation between the inputs and the output of the fuzzy controller can be rep-
resented as a 3-D drawing, which is called surface function and is shown in Fig. 4.16.
It is clear that the surface function is approximately smooth, which enhances the sta-
bility of the fuzzy system.
2.2 SIMULATION RESULTS
The radiation and temperature data used in simulation are from realistic hourly data
of the Riyadh city of Saudi Arabia. These data are concentrated in a narrow range of
time (640 s), which approves the robustness of the fuzzy-controlled system. Six PV
modules have been used in the simulation and each produces 75 W, 12 V, and 4.4 A.
The simulation is carried out with FLC and the constant-voltage technique for the
purpose of comparison. These two MPPT techniques have been compared with theo-
retical maximum power from PV module, which can be calculated using a Matlab
code. The load is connected with a PV array through a battery. The value of
SOC L of the battery is chosen to be 99% to reduce the time of simulation.
Fig. 4.17 shows in the first trace the solar radiation used in the simulation. In the sec-
ond trace of Fig. 4.17, the output power for FLC (black color) and constant-voltage
MPPT technique (blue colored) are compared with the theoretical values of MPPT
(red colored). It is clear from second trace that the power output with FLC is
following the theoretical MPP exactly but the output power with constant-voltage
control is considerably lower than that associated with FLC. Moreover, FLC can
restrain any overshooting in the input or output variables.