
Page 157 - Advances in Renewable Energies and Power Technologies
P. 157
130 CHAPTER 4 Performance of MPPT Techniques of Photovoltaic Systems
P PV L P
S 1 S 2
PV
system Battery Load
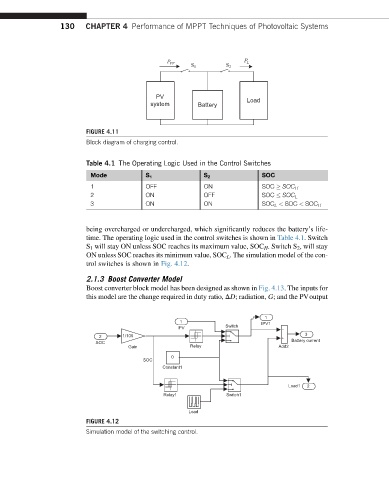
FIGURE 4.11
Block diagram of charging control.
Table 4.1 The Operating Logic Used in the Control Switches
Mode S 1 S 2 SOC
1 OFF ON SOC SOC H
2 ON OFF SOC SOC L
3 ON ON SOC L < SOC < SOC H
being overcharged or undercharged, which significantly reduces the battery’s life-
time. The operating logic used in the control switches is shown in Table 4.1. Switch
S 1 will stay ON unless SOC reaches its maximum value, SOC H . Switch S 2 , will stay
ON unless SOC reaches its minimum value, SOC L . The simulation model of the con-
trol switches is shown in Fig. 4.12.
2.1.3 Boost Converter Model
Boost converter block model has been designed as shown in Fig. 4.13. The inputs for
this model are the change required in duty ratio, DD; radiation, G; and the PVoutput
1
1 IPV1
IPV Switch
2 1/100 3
SOC Battery current
Gain Relay Add2
0
SOC
Constant1
Load1 2
Relay1 Switch1
Load
FIGURE 4.12
Simulation model of the switching control.