
Page 155 - Advances in Renewable Energies and Power Technologies
P. 155
128 CHAPTER 4 Performance of MPPT Techniques of Photovoltaic Systems
The module current can be obtained by:
(4.16)
I M ¼ I PVC N PC
PVarrays are represented by the number of modules connected in series, M S , and the
number of modules in parallel, M P , where the PV array voltage and current are
given as:
(4.17)
V PV ¼ V PVC N SC M S
I PV ¼ I PVC N PC M P (4.18)
2.1.2 Battery and Load Model
The battery model is shown in many studies and explained in detail in the study by
Castaner and Silvestre [64]. The accuracy of this model data is very important in the
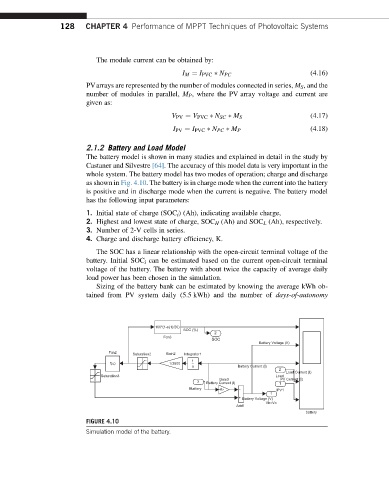
whole system. The battery model has two modes of operation; charge and discharge
as shown in Fig. 4.10. The battery is in charge mode when the current into the battery
is positive and in discharge mode when the current is negative. The battery model
has the following input parameters:
1. Initial state of charge (SOC i ) (Ah), indicating available charge,
2. Highest and lowest state of charge, SOC H (Ah) and SOC L (Ah), respectively.
3. Number of 2-V cells in series.
4. Charge and discharge battery efficiency, K.
The SOC has a linear relationship with the open-circuit terminal voltage of the
battery. Initial SOC i can be estimated based on the current open-circuit terminal
voltage of the battery. The battery with about twice the capacity of average daily
load power has been chosen in the simulation.
Sizing of the battery bank can be estimated by knowing the average kWh ob-
tained from PV system daily (5.5 kWh) and the number of days-of-autonomy
100*(1-u(1)/20)
SOC (%)
2
Fcn3
SOC
Battery Voltage (V)
Fcn2 Saturation2 Gain2 Integrator1
1
f(u) 1/3600
s Battery Current (I)
2
Load Current (I)
Saturation3 Load
Gain3 PV Current (I)
3 Battery Current (I) 1
IBattery -K- IPV1
1
Battery Voltage (V)
Vb=Vo
Add1
battery
FIGURE 4.10
Simulation model of the battery.