
Page 153 - Advances in Renewable Energies and Power Technologies
P. 153
126 CHAPTER 4 Performance of MPPT Techniques of Photovoltaic Systems
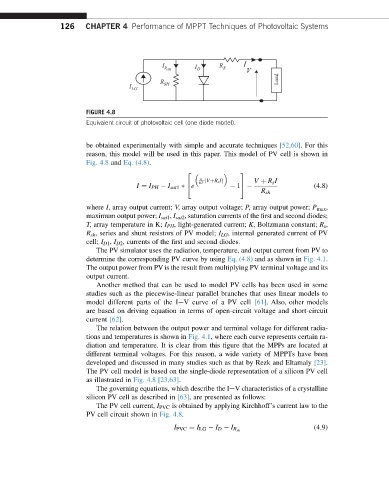
I R SH I D R S I V
R Load
I LG SH
FIGURE 4.8
Equivalent circuit of photovoltaic cell (one diode model).
be obtained experimentally with simple and accurate techniques [52,60]. For this
reason, this model will be used in this paper. This model of PV cell is shown in
Fig. 4.8 and Eq. (4.8).
2 3
q
ðVþR s IÞ V þ R s I
KT
I ¼ I PH I sat1 e 1 (4.8)
4
5
R sh
where I, array output current; V, array output voltage; P, array output power; P max ,
maximum output power; I sat1 , I sat2 , saturation currents of the first and second diodes;
T, array temperature in K; I PH , light-generated current; K, Boltzmann constant; R s ,
R sh , series and shunt resistors of PV model; I LG , internal generated current of PV
cell; I D1 , I D2 , currents of the first and second diodes.
The PV simulator uses the radiation, temperature, and output current from PV to
determine the corresponding PV curve by using Eq. (4.8) and as shown in Fig. 4.1.
The output power from PV is the result from multiplying PV terminal voltage and its
output current.
Another method that can be used to model PV cells has been used in some
studies such as the piecewise-linear parallel branches that uses linear models to
model different parts of the IeVcurve of aPVcell [61]. Also, other models
are based on driving equation in terms of open-circuit voltage and short-circuit
current [62].
The relation between the output power and terminal voltage for different radia-
tions and temperatures is shown in Fig. 4.1, where each curve represents certain ra-
diation and temperature. It is clear from this figure that the MPPs are located at
different terminal voltages. For this reason, a wide variety of MPPTs have been
developed and discussed in many studies such as that by Rezk and Eltamaly [23].
The PV cell model is based on the single-diode representation of a silicon PV cell
as illustrated in Fig. 4.8 [23,63].
The governing equations, which describe the IeV characteristics of a crystalline
silicon PV cell as described in [63], are presented as follows:
The PV cell current, I PVC is obtained by applying Kirchhoff’s current law to the
PV cell circuit shown in Fig. 4.8.
(4.9)
I PVC ¼ I LG I D I R sh