Page 329 - Advances in Renewable Energies and Power Technologies
P. 329

302    CHAPTER 9 Design Principles of Photovoltaic Irrigation Systems


                         FIGURE 9.3
                         Solar module.
                            certain voltage that is the largest it can withstand in the generation region, or
                            voltage to open circuit V oc . It is the maximum voltage achieved by a solar cell
                            in silicon cells
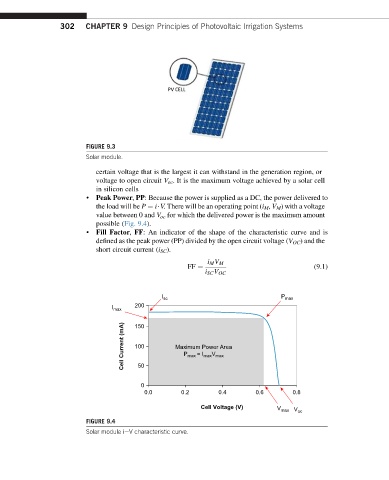
                         •  Peak Power, PP: Because the power is supplied as a DC, the power delivered to
                            the load will be P ¼ i$V. There will be an operating point (i M , V M ) with a voltage
                            value between 0 and V oc for which the delivered power is the maximum amount
                            possible (Fig. 9.4).
                         •  Fill Factor, FF: An indicator of the shape of the characteristic curve and is
                            defined as the peak power (PP) divided by the open circuit voltage (V OC ) and the
                            short circuit current (i SC ).
                                                           i M V M
                                                     FF ¼                               (9.1)
                                                          i SC V OC


                                              I sc                             P max
                                I max  200

                                   Cell Current (mA)  100  Maximum Power Area
                                      150


                                                    P
                                                            V
                                                        = I
                                                         max max
                                                     max
                                       50
                                        0
                                         0.0       0.2        0.4       0.6       0.8
                                                         Cell Voltage (V)     V max V oc
                         FIGURE 9.4
                         Solar module ieV characteristic curve.
   324   325   326   327   328   329   330   331   332   333   334