
Page 397 - Aircraft Stuctures for Engineering Student
P. 397
378 Stress analysis of aircraft components
Table 10.3
Skin panel Boom B, (mm’) Y, (m) qb (N/m)
12 - - - 0
23 2 216.6 352.0 -30.3
34 3 216.6 269.5 -53.5
45 4 216.7 145.8 -66.0
56 5 - 0 -66.0
67 6 216.1 -145.8 -53.5
78 1 216.6 -269.5 -30.3
89 8 216.6 -352.0 0
1 16 1 216.6 381.0 -32.8
16 15 16 216.6 352.0 -63.1
15 14 15 216.6 269.5 -86.3
14 13 14 216.6 145.8 -98.8
13 12 13 - 0 -98.8
12 11 12 216.7 -145.8 -86.3
11 10 11 216.6 -269.5 -63.1
10 9 10 216.6 -352.0 -32.8
positive. Clearly A12 = A23 = .-- = AI6, = 4.56 x 10⁵/16 = 285OOmm’. Equation
(iv) then become
100 X lo3 X 150 2 x 28 500(-qb,, - qbz - . ’ ’ - qb161) + 4-56 lo5q3,0 (v)
Substituting the values of qb from Table 10.3 in Eq. (v), we obtain
100 x lo3 x 150 = 2 x 28 500(-262.4) + 2 x 4.56 x 105q3,0
from which
qs;o = 32.8 N/mm (acting in an anticlockwise sense)
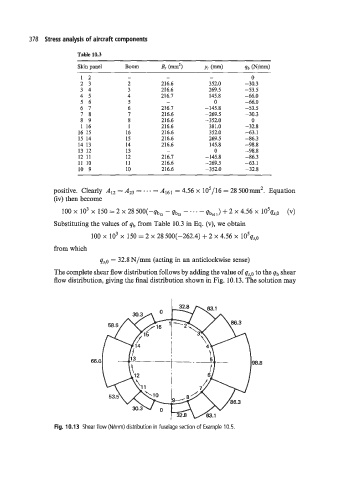
The complete shear flow distribution follows by adding the value of qs;o to the qb shear
flow distribution, giving the final distribution shown in Fig. 10.13. The solution may
Fig. 10.13 Shear flow (Wmm) distribution in fuselage section of Example 10.5.