
Page 239 -
P. 239
IMPROVING THE SOLUTION 219
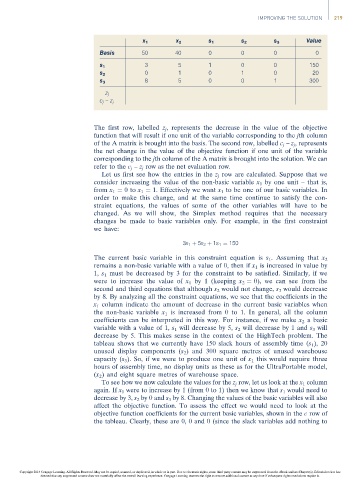
x 1 x 2 s 1 s 2 s 3 Value
Basis 50 40 0 0 0 0
3 5 1 0 0 150
s 1
0 1 0 1 0 20
s 2
8 5 0 0 1 300
s 3
z j
c j –z j
The first row, labelled z j , represents the decrease in the value of the objective
function that will result if one unit of the variable corresponding to the jth column
of the A matrix is brought into the basis. The second row, labelled c j – z j , represents
the net change in the value of the objective function if one unit of the variable
corresponding to the jth column of the A matrix is brought into the solution. We can
refer to the c j – z j row as the net evaluation row.
Let us first see how the entries in the z j row are calculated. Suppose that we
consider increasing the value of the non-basic variable x 1 by one unit – that is,
from x 1 ¼ 0to x 1 ¼ 1. Effectively we want x 1 to be one of our basic variables. In
order to make this change, and at the same time continue to satisfy the con-
straint equations, the values of some of the other variables will have to be
changed. As we will show, the Simplex method requires that the necessary
changes be made to basic variables only. For example, in the first constraint
we have:
3x 1 þ 5x 2 þ 1s 1 ¼ 150
The current basic variable in this constraint equation is s 1 .Assumingthat x 2
remains a non-basic variable with a value of 0, then if x 1 is increased in value by
1, s 1 must be decreased by 3 for the constraint to be satisfied. Similarly, if we
wereto increasethevalueof x 1 by 1 (keeping x 2 ¼ 0), wecan seefromthe
second and third equations that although s 2 would not change, s 3 would decrease
by 8. By analyzing all the constraint equations, we see that the coefficients in the
x 1 column indicate the amount of decrease in the current basic variables when
the non-basic variable x 1 is increased from 0 to 1. In general, all the column
coefficients can be interpreted in this way. For instance, if we make x 2 abasic
variable with a value of 1, s 1 will decrease by 5, s 2 will decrease by 1 and s 3 will
decrease by 5. This makes sense in the context of the HighTech problem. The
tableau shows that we currently have 150 slack hours of assembly time (s 1 ), 20
unused display components (s 2 ) and 300 square metres of unused warehouse
capacity (s 3 ). So, if we were to produce one unit of x 1 this would require three
hours of assembly time, no display units as these as for the UltraPortable model,
(x 2 ) and eight square metres of warehouse space.
To see how we now calculate the values for the z j row, let us look at the x 1 column
again. If x 1 were to increase by 1 (from 0 to 1) then we know that s 1 would need to
decrease by 3, s 2 by 0 and s 3 by 8. Changing the values of the basic variables will also
affect the objective function. To assess the effect we would need to look at the
objective function coefficients for the current basic variables, shown in the c row of
the tableau. Clearly, these are 0, 0 and 0 (since the slack variables add nothing to
Copyright 2014 Cengage Learning. All Rights Reserved. May not be copied, scanned, or duplicated, in whole or in part. Due to electronic rights, some third party content may be suppressed from the eBook and/or eChapter(s). Editorial review has
deemed that any suppressed content does not materially affect the overall learning experience. Cengage Learning reserves the right to remove additional content at any time if subsequent rights restrictions require it.