
Page 571 -
P. 571
RISK ANALYSIS AND SENSITIVITY ANALYSIS 551
NOTES AND COMMENTS
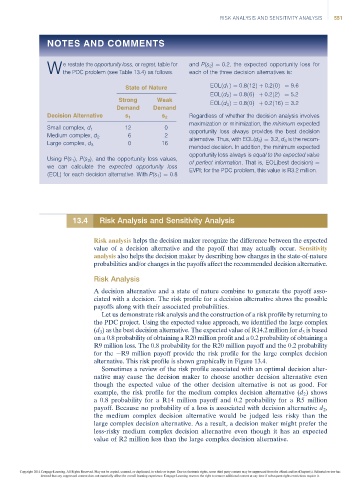
e restate the opportunity loss,or regret, table for and P(s 2 ) ¼ 0.2, the expected opportunity loss for
W the PDC problem (see Table 13.4) as follows. each of the three decision alternatives is:
EOLðd 1 Þ¼ 0:8ð12Þþ 0:2ð0Þ¼ 9:6
State of Nature
EOLðd 2 Þ¼ 0:8ð6Þþ 0:2ð2Þ¼ 5:2
Strong Weak
EOLðd 3 Þ¼ 0:8ð0Þþ 0:2ð16Þ¼ 3:2
Demand Demand
Decision Alternative s 1 s 2 Regardless of whether the decision analysis involves
maximization or minimization, the minimum expected
12 0
Small complex, d 1
opportunity loss always provides the best decision
6 2
Medium complex, d 2
alternative. Thus, with EOL(d 3 ) ¼ 3.2, d 3 is the recom-
0 16
Large complex, d 3
mended decision. In addition, the minimum expected
opportunity loss always is equal to the expected value
Using P(s 1 ), P(s 2 ), and the opportunity loss values,
of perfect information. That is, EOL(best decision) ¼
we can calculate the expected opportunity loss
EVPI; for the PDC problem, this value is R3.2 million.
(EOL) for each decision alternative. With P(s 1 ) ¼ 0.8
13.4 Risk Analysis and Sensitivity Analysis
Risk analysis helps the decision maker recognize the difference between the expected
value of a decision alternative and the payoff that may actually occur. Sensitivity
analysis also helps the decision maker by describing how changes in the state-of-nature
probabilities and/or changes in the payoffs affect the recommended decision alternative.
Risk Analysis
A decision alternative and a state of nature combine to generate the payoff asso-
ciated with a decision. The risk profile for a decision alternative shows the possible
payoffs along with their associated probabilities.
Let us demonstrate risk analysis and the construction of a risk profile by returning to
the PDC project. Using the expected value approach, we identified the large complex
(d 3 ) as the best decision alternative. The expected value of R14.2 million for d 3 is based
on a 0.8 probability of obtaining a R20 million profit and a 0.2 probability of obtaining a
R9 million loss. The 0.8 probability for the R20 million payoff and the 0.2 probability
for the R9 million payoff provide the risk profile for the large complex decision
alternative. This risk profile is shown graphically in Figure 13.4.
Sometimes a review of the risk profile associated with an optimal decision alter-
native may cause the decision maker to choose another decision alternative even
though the expected value of the other decision alternative is not as good. For
example, the risk profile for the medium complex decision alternative (d 2 ) shows
a 0.8 probability for a R14 million payoff and 0.2 probability for a R5 million
payoff. Because no probability of a loss is associated with decision alternative d 2 ,
the medium complex decision alternative would be judged less risky than the
large complex decision alternative. As a result, a decision maker might prefer the
less-risky medium complex decision alternative even though it has an expected
value of R2 million less than the large complex decision alternative.
Copyright 2014 Cengage Learning. All Rights Reserved. May not be copied, scanned, or duplicated, in whole or in part. Due to electronic rights, some third party content may be suppressed from the eBook and/or eChapter(s). Editorial review has
deemed that any suppressed content does not materially affect the overall learning experience. Cengage Learning reserves the right to remove additional content at any time if subsequent rights restrictions require it.