
Page 577 -
P. 577
DECISION ANALYSIS WITH SAMPLE INFORMATION 557
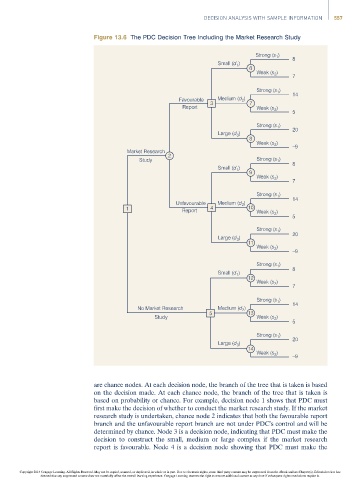
Figure 13.6 The PDC Decision Tree Including the Market Research Study
Strong (s ) 8
1
Small (d 1 )
6
Weak (s )
2
7
Strong (s ) 14
1
Favourable 3 Medium (d 2 ) 7
Report Weak (s 2 )
5
Strong (s )
1
Large (d 3 ) 20
8
Weak (s 2 )
–9
Market Research
2
Study Strong (s 1 ) 8
Small (d 1 )
9
Weak (s ) 7
2
Strong (s )
1
Unfavourable Medium (d 2 ) 14
1 Report 4 10
Weak (s 2 )
5
Strong (s )
1
Large (d ) 20
3
11
Weak (s )
2
–9
Strong (s 1 )
8
Small (d )
1
12
Weak (s )
2
7
Strong (s 1 )
14
No Market Research Medium (d 2 )
5 13
Study Weak (s 2 )
5
Strong (s 1 )
Large (d ) 20
3
14
Weak (s 2 )
–9
are chance nodes. At each decision node, the branch of the tree that is taken is based
on the decision made. At each chance node, the branch of the tree that is taken is
based on probability or chance. For example, decision node 1 shows that PDC must
first make the decision of whether to conduct the market research study. If the market
research study is undertaken, chance node 2 indicates that both the favourable report
branch and the unfavourable report branch are not under PDC’s control and will be
determined by chance. Node 3 is a decision node, indicating that PDC must make the
decision to construct the small, medium or large complex if the market research
report is favourable. Node 4 is a decision node showing that PDC must make the
Copyright 2014 Cengage Learning. All Rights Reserved. May not be copied, scanned, or duplicated, in whole or in part. Due to electronic rights, some third party content may be suppressed from the eBook and/or eChapter(s). Editorial review has
deemed that any suppressed content does not materially affect the overall learning experience. Cengage Learning reserves the right to remove additional content at any time if subsequent rights restrictions require it.