
Page 582 -
P. 582
562 CHAPTER 13 DECISION ANALYSIS
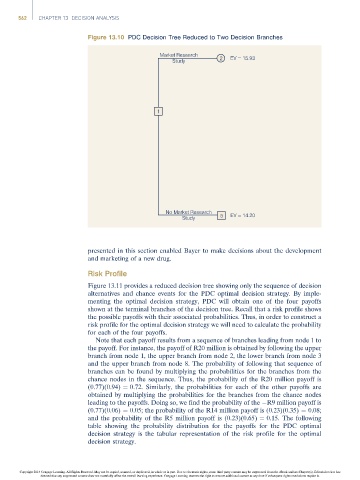
Figure 13.10 PDC Decision Tree Reduced to Two Decision Branches
Market Research
Study 2 EV = 15.93
1
No Market Research
Study 5 EV = 14.20
presented in this section enabled Bayer to make decisions about the development
and marketing of a new drug.
Risk Profile
Figure 13.11 provides a reduced decision tree showing only the sequence of decision
alternatives and chance events for the PDC optimal decision strategy. By imple-
menting the optimal decision strategy, PDC will obtain one of the four payoffs
shown at the terminal branches of the decision tree. Recall that a risk profile shows
the possible payoffs with their associated probabilities. Thus, in order to construct a
risk profile for the optimal decision strategy we will need to calculate the probability
for each of the four payoffs.
Note that each payoff results from a sequence of branches leading from node 1 to
the payoff. For instance, the payoff of R20 million is obtained by following the upper
branch from node 1, the upper branch from node 2, the lower branch from node 3
and the upper branch from node 8. The probability of following that sequence of
branches can be found by multiplying the probabilities for the branches from the
chance nodes in the sequence. Thus, the probability of the R20 million payoff is
(0.77)(0.94) ¼ 0.72. Similarly, the probabilities for each of the other payoffs are
obtained by multiplying the probabilities for the branches from the chance nodes
leading to the payoffs. Doing so, we find the probability of the R9 million payoff is
(0.77)(0.06) ¼ 0.05; the probability of the R14 million payoff is (0.23)(0.35) ¼ 0.08;
and the probability of the R5 million payoff is (0.23)(0.65) ¼ 0.15. The following
table showing the probability distribution for the payoffs for the PDC optimal
decision strategy is the tabular representation of the risk profile for the optimal
decision strategy.
Copyright 2014 Cengage Learning. All Rights Reserved. May not be copied, scanned, or duplicated, in whole or in part. Due to electronic rights, some third party content may be suppressed from the eBook and/or eChapter(s). Editorial review has
deemed that any suppressed content does not materially affect the overall learning experience. Cengage Learning reserves the right to remove additional content at any time if subsequent rights restrictions require it.