
Page 587 -
P. 587
CALCULATING BRANCH PROBABILITIES 567
Market Research
State of Nature Favourable, F Unfavourable, U
P(F|s 1 ) ¼ 0.90 P(U|s 1 ) ¼ 0.10
Strong demand, s 1
P(F|s 2 ) ¼ 0.25 P(U|s 2 ) ¼ 0.75
Weak demand, s 2
Note that the preceding probability assessments provide a reasonable degree of
confidence in the market research study. If the true state of nature is s 1 , the
probability of a favourable market research report is 0.90 and the probability of an
unfavourable market research report is 0.10. If the true state of nature is s 2 ,the
probability of a favourable market research report is 0.25 and the probability of an
unfavourable market research report is 0.75.
The reason for a 0.25 probability of a potentially misleading favourable market
research report for state of nature s 2 is that when some potential buyers first hear
about the new project, their enthusiasm may lead them to overstate their real
interest in it. A potential buyer’s initial favourable response can change quickly to
a ‘no thank you’ when later faced with the reality of signing a purchase contract and
making a down payment.
In the following discussion, we present a tabular approach as a convenient
method for carrying out the probability calculations. The calculations for the
PDC problem based on a favourable market research report (F) are summarized
in Table 13.7. The steps used to develop this table are as follows:
Step 1. In column 1 enter the states of nature. In column 2 enter the prior
probabilities for the states of nature. In column 3 enter the conditional
probabilities of a favourable market research report (F) given each state of
nature.
Step 2. In column 4 calculate the joint probabilities by multiplying the prior
probability values in column 2 by the corresponding conditional
probability values in column 3.
Step 3. Sum the joint probabilities in column 4 to obtain the probability of a
favourable market research report, P(F).
Step 4. Divide each joint probability in column 4 by P(F) ¼ 0.77 to obtain the
revised or posterior probabilities, P(s 1 |F) and P(s 2 |F).
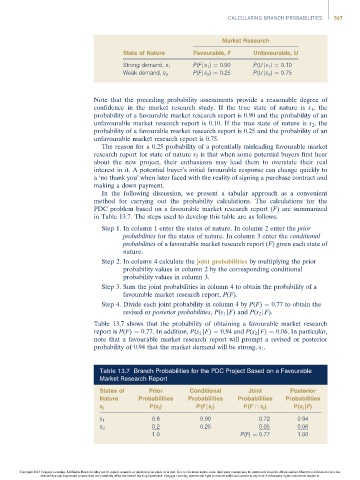
Table 13.7 shows that the probability of obtaining a favourable market research
report is P(F) ¼ 0.77. In addition, P(s 1 |F) ¼ 0.94 and P(s 2 |F) ¼ 0.06. In particular,
note that a favourable market research report will prompt a revised or posterior
probability of 0.94 that the market demand will be strong, s 1 .
Table 13.7 Branch Probabilities for the PDC Project Based on a Favourable
Market Research Report
States of Prior Conditional Joint Posterior
Nature Probabilities Probabilities Probabilities Probabilities
P(s j ) P(F|s j ) P(F \ s j ) P(s j |F)
s j
0.8 0.90 0.72 0.94
s 1
0.2 0.25 0.05 0.06
s 2
1.0 P(F) ¼ 0.77 1.00
Copyright 2014 Cengage Learning. All Rights Reserved. May not be copied, scanned, or duplicated, in whole or in part. Due to electronic rights, some third party content may be suppressed from the eBook and/or eChapter(s). Editorial review has
deemed that any suppressed content does not materially affect the overall learning experience. Cengage Learning reserves the right to remove additional content at any time if subsequent rights restrictions require it.