
Page 585 -
P. 585
DECISION ANALYSIS WITH SAMPLE INFORMATION 565
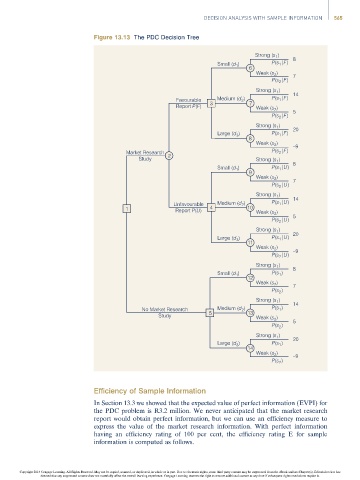
Figure 13.13 The PDC Decision Tree
Strong (s ) 8
1
Small (d ) P(s 1 |F )
1
6
Weak (s 2 ) 7
P(s |F )
2
Strong (s ) 14
1
Favourable 3 Medium (d ) 7 P(s |F )
1
2
Report P(F) Weak (s )
2
P(s 2 |F ) 5
Strong (s 1 ) 20
Large (d ) P(s |F )
1
3
8
Weak (s 2 ) –9
Market Research P(s 2 |F )
Study 2 Strong (s 1 ) 8
1
Small (d 1 ) P(s |U )
9
Weak (s 2 ) 7
P(s 2 |U )
Strong (s 1 ) 14
Unfavourable Medium (d ) P(s |U )
1
2
1 Report P(U) 4 10
Weak (s 2 ) 5
P(s 2 |U )
Strong (s 1 )
Large (d ) P(s |U ) 20
1
3
11
Weak (s 2 ) –9
P(s 2 |U )
Strong (s ) 8
1
Small (d 1 ) P(s 1 )
12
Weak (s 2 ) 7
P(s 2 )
Strong (s 1 ) 14
No Market Research Medium (d ) P(s 1 )
2
Study 5 13
Weak (s 2 ) 5
P(s 2 )
Strong (s )
1
Large (d ) P(s 1 ) 20
3
14
Weak (s 2 ) –9
P(s 2 )
Efficiency of Sample Information
In Section 13.3 we showed that the expected value of perfect information (EVPI) for
the PDC problem is R3.2 million. We never anticipated that the market research
report would obtain perfect information, but we can use an efficiency measure to
express the value of the market research information. With perfect information
having an efficiency rating of 100 per cent, the efficiency rating E for sample
information is computed as follows.
Copyright 2014 Cengage Learning. All Rights Reserved. May not be copied, scanned, or duplicated, in whole or in part. Due to electronic rights, some third party content may be suppressed from the eBook and/or eChapter(s). Editorial review has
deemed that any suppressed content does not materially affect the overall learning experience. Cengage Learning reserves the right to remove additional content at any time if subsequent rights restrictions require it.