
Page 580 -
P. 580
560 CHAPTER 13 DECISION ANALYSIS
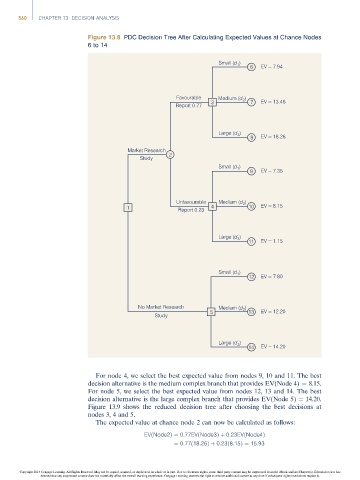
Figure 13.8 PDC Decision Tree After Calculating Expected Values at Chance Nodes
6to14
Small (d ) 6 EV = 7.94
1
Favourable Medium (d )
2
Report 0.77 3 7 EV = 13.46
Large (d )
3
8 EV = 18.26
Market Research
Study 2
Small (d 1 )
9 EV = 7.35
Unfavourable Medium (d )
2
1 Report 0.23 4 10 EV = 8.15
Large (d )
3
11 EV = 1.15
Small (d 1 )
12 EV = 7.80
No Market Research Medium (d )
2
5 13 EV = 12.20
Study
Large (d )
3
14 EV = 14.20
For node 4, we select the best expected value from nodes 9, 10 and 11. The best
decision alternative is the medium complex branch that provides EV(Node 4) ¼ 8.15.
For node 5, we select the best expected value from nodes 12, 13 and 14. The best
decision alternative is the large complex branch that provides EV(Node 5) ¼ 14.20.
Figure 13.9 shows the reduced decision tree after choosing the best decisions at
nodes 3, 4 and 5.
The expected value at chance node 2 can now be calculated as follows:
EVðNode2Þ¼ 0:77EVðNode3Þþ 0:23EVðNode4Þ
¼ 0:77ð18:26Þþ 0:23ð8:15Þ¼ 15:93
Copyright 2014 Cengage Learning. All Rights Reserved. May not be copied, scanned, or duplicated, in whole or in part. Due to electronic rights, some third party content may be suppressed from the eBook and/or eChapter(s). Editorial review has
deemed that any suppressed content does not materially affect the overall learning experience. Cengage Learning reserves the right to remove additional content at any time if subsequent rights restrictions require it.