Page 579 -
P. 579

DECISION ANALYSIS WITH SAMPLE INFORMATION  559


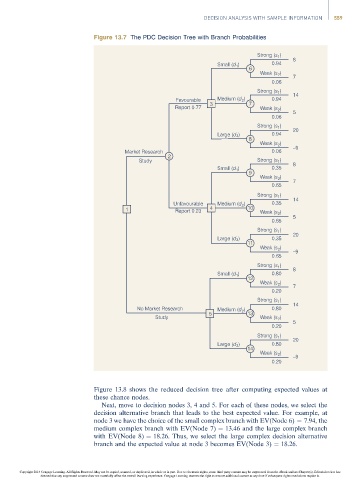
                                      Figure 13.7 The PDC Decision Tree with Branch Probabilities

                                                                                         Strong (s )  8
                                                                                               1
                                                                            Small (d )       0.94
                                                                                  1
                                                                                      6
                                                                                         Weak (s )  7
                                                                                               2
                                                                                             0.06
                                                                                         Strong (s )  14
                                                                                               1
                                                                Favourable  Medium (d )      0.94
                                                                                    2
                                                               Report 0.77  3         7  Weak (s )
                                                                                               2
                                                                                             0.06   5
                                                                                         Strong (s )  20
                                                                                               1
                                                                            Large (d 3)      0.94
                                                                                      8
                                                                                         Weak (s 2 )  –9
                                                Market Research                              0.06
                                                             2
                                                    Study                                Strong (s 1 )  8
                                                                            Small (d 1 )     0.35
                                                                                      9
                                                                                         Weak (s 2 )  7
                                                                                             0.65
                                                                                         Strong (s 1 )  14
                                                               Unfavourable  Medium (d )     0.35
                                                                                    2
                                                1              Report 0.23  4         10  Weak (s 2 )
                                                                                                    5
                                                                                             0.65
                                                                                         Strong (s 1 )
                                                                                                    20
                                                                            Large (d 3)      0.35
                                                                                      11
                                                                                         Weak (s 2 )  –9
                                                                                             0.65
                                                                                         Strong (s )  8
                                                                                               1
                                                                            Small (d 1 )     0.80
                                                                                      12
                                                                                         Weak (s 2 )  7
                                                                                             0.20
                                                                                         Strong (s 1 )  14
                                                    No Market Research      Medium (d )      0.80
                                                                                    2
                                                                          5           13
                                                         Study                           Weak (s 2 )
                                                                                                    5
                                                                                             0.20
                                                                                         Strong (s 1 )  20
                                                                            Large (d 3)      0.80
                                                                                      14
                                                                                         Weak (s )  –9
                                                                                               2
                                                                                             0.20


                                      Figure 13.8 shows the reduced decision tree after computing expected values at
                                      these chance nodes.
                                         Next, move to decision nodes 3, 4 and 5. For each of these nodes, we select the
                                      decision alternative branch that leads to the best expected value. For example, at
                                      node 3 we have the choice of the small complex branch with EV(Node 6) ¼ 7.94, the
                                      medium complex branch with EV(Node 7) ¼ 13.46 and the large complex branch
                                      with EV(Node 8) ¼ 18.26. Thus, we select the large complex decision alternative
                                      branch and the expected value at node 3 becomes EV(Node 3) ¼ 18.26.


                Copyright 2014 Cengage Learning. All Rights Reserved. May not be copied, scanned, or duplicated, in whole or in part. Due to electronic rights, some third party content may be suppressed from the eBook and/or eChapter(s). Editorial review has
                      deemed that any suppressed content does not materially affect the overall learning experience. Cengage Learning reserves the right to remove additional content at any time if subsequent rights restrictions require it.
   574   575   576   577   578   579   580   581   582   583   584