Page 189 - Analog and Digital Filter Design
P. 189

1 86 Analog and Digital Filter Design


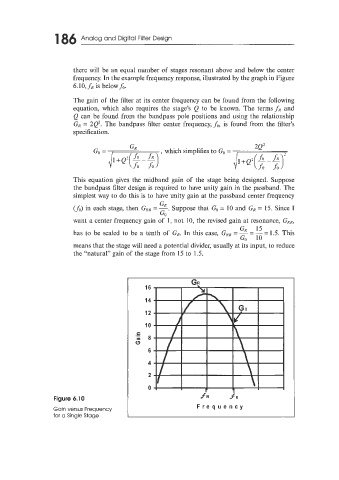
                       there will  be an equal number of  stages resonant above and below the center
                       frequency. In the example frequency response, illustrated by the graph in Figure
                       6.10, fR  is belowfo.
                       The gain of  the filter at its center frequency can be found from the following
                       equation, which  also requires the  stage’s Q  to  be  known. The terms fR and
                       Q can be found from the bandpass pole positions and using the relationship
                       GR  = 2Q’.  The bandpass  filter center frequency, fo, is  found from the filter’s
                       specification.

                                        GR                                    2Q’
                                                  , which simplifies to Go =
                                         fR  fo

                       This equation  gives the midband  gain of  the  stage being designed. Suppose
                       the bandpass filter design is required to have unity gain in the passband. The
                       simplest way to do this is to have unity gain at the passband center frequency
                                                 GR
                       (fo) in each stage, then  GRR  = -.   Suppose that  Go = 10 and  GR  = 15. Since I
                                                  GO
                       want a center frequency gain of  1, not  10, the revised gain at resonance, GRR,
                       has to be scaled to be  a tenth of  GR. In this case,  GRR  = G, = Is = 1.5. This
                                                                          Go   10
                       means that the stage will need a potential divider, usually at its input, to reduce
                       the “natural” gain of the stage from 15 to  1.5.


                                         - -
                                                           GR
                                             16
                                             14

                                             12
                                             10
                                          C  .-
                                          (Is   8
                                          Q
                                              6
                                              4
                                              2

                                              0
                 Figure 6.10                                  f  R
                 Gain versus Frequency                       Frequency
                 for a Single Stage
   184   185   186   187   188   189   190   191   192   193   194