
Page 361 - Analog and Digital Filter Design
P. 361
358 Analog and Digital Filter Design
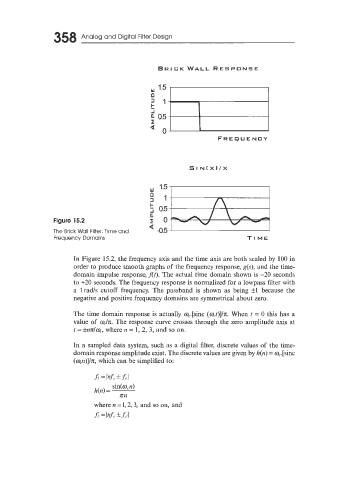
BRICK WALL RESPONSE
FREQUENCY
W
I-
1 0.5
n
Figure 15.2 E O
The Brick Wall Filter: Time and a 4.5
Frequency Domains TI ME
In Figure 15.2, the frequency axis and the time axis are both scaled by 100 in
order to produce smooth graphs of the frequency response, g(s), and the time-
domain impulse response, fit). The actual time domain shown is -20 seconds
to +20 seconds. The frequency response is normalized for a lowpass filter with
a lrad/s cutoff frequency. The passband is shown as being fl because the
negative and positive frequency domains are symmetrical about zero.
The time domain response is actually w,.[sinc (act)]/n. When t = 0 this has a
value of wJn. The response curve crosses through the zero amplitude axis at
t = kndm,, where n = 1, 2, 3, and so on.
In a sampled data system, such as a digital filter, discrete values of the time-
domain response amplitude exist. The discrete values are given by h(n) = w,.[sinc
(wp)]/n, which can be simplified to:
sin(w,.rz)
h(n) =
zn
~
where n = 1,2,3, and so on, and
fl = IM * Ll