
Page 401 - Analog and Digital Filter Design
P. 401
398 Analog and Digital Filter Design
ncreasing frequency
Zero I Sampling
I Frequency
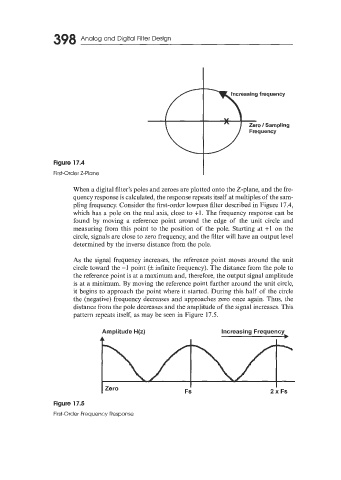
Figure 17.4
First-Order Z-Plane
When a digital filter’s poles and zeroes are plotted onto the Z-plane, and the fre-
quency response is calculated, the response repeats itself at multiples of the sam-
pling frequency. Consider the first-order lowpass filter described in Figure 17.4,
which has a pole on the real axis, close to +l. The frequency response can be
found by moving a reference point around the edge of the unit circle and
measuring from this point to the position of the pole. Starting at +1 on the
circle, signals are close to zero frequency, and the filter will have an output level
determined by the inverse distance from the pole.
As the signal frequency increases, the reference point moves around the unit
circle toward the -1 point (k infinite frequency). The distance from the pole to
the reference point is at a maximum and, therefore, the output signal amplitude
is at a minimum. By moving the reference point further around the unit circle,
it begins to approach the point where it started. During this half of the circle
the (negative) frequency decreases and approaches zero once again. Thus, the
distance from the pole decreases and the amplitude of the signal increases. This
pattern repeats itself, as may be seen in Figure 17.5.
Amplitude H(z) Increasing Frequency
A
Zero
Fs 2 x Fs
Figure 17.5
First-Order Frequency Response