
Page 62 - Analog and Digital Filter Design
P. 62
59
Time and Frequency Response
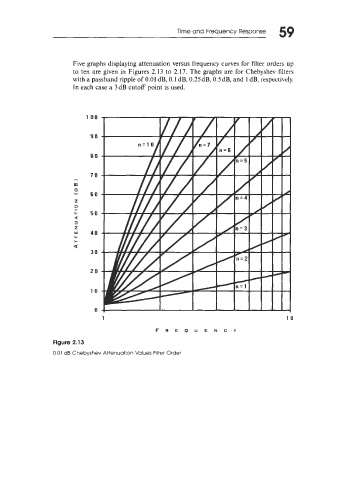
Five graphs displaying attenuation versus frequency curves for filter orders up
to ten are given in Figures 2.13 to 2.17. The graphs are for Chebyshev filters
with a passband ripple of 0.01 dB, 0.1 dB, 0.25dB, OSdB, and 1 dB, respectively.
In each case a 3dB cutoff point is used.
100
90
80
70
60
50
40
30
20
10
".
n
1 10
F R E Q U E N C Y
Figure 2.13
0.01 dB Chebyshev Attenuation Values Filter Order