
Page 392 - Analysis, Synthesis and Design of Chemical Processes, Third Edition
P. 392
separation processes on triangular diagrams in extraction processes [18,19]. The line connecting points
D, F, and B is a representation of the overall material balance on the column. As a consequence of the
requirement of the overall material balance, for a column (with only one feed and without side streams) to
be feasible, the points D, F, and B must lie on the same straight line.
Instead of using the equilibrium curve, as is done in the McCabe-Thiele diagram, on a triangular diagram,
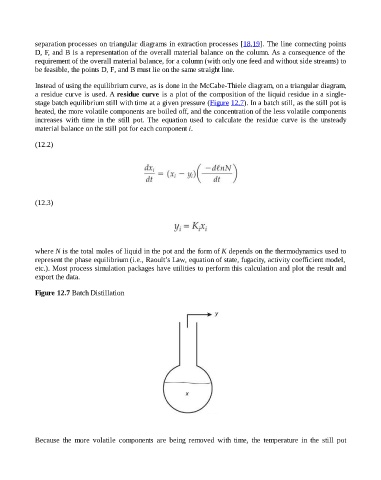
a residue curve is used. A residue curve is a plot of the composition of the liquid residue in a single-
stage batch equilibrium still with time at a given pressure (Figure 12.7). In a batch still, as the still pot is
heated, the more volatile components are boiled off, and the concentration of the less volatile components
increases with time in the still pot. The equation used to calculate the residue curve is the unsteady
material balance on the still pot for each component i.
(12.2)
(12.3)
where N is the total moles of liquid in the pot and the form of K depends on the thermodynamics used to
represent the phase equilibrium (i.e., Raoult’s Law, equation of state, fugacity, activity coefficient model,
etc.). Most process simulation packages have utilities to perform this calculation and plot the result and
export the data.
Figure 12.7 Batch Distillation
Because the more volatile components are being removed with time, the temperature in the still pot