
Page 101 - Analytical Electrochemistry 2d Ed - Jospeh Wang
P. 101
86 CONTROLLED-POTENTIAL TECHNIQUES
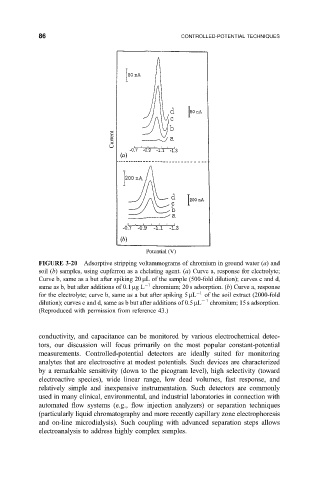
FIGURE 3-20 Adsorptive stripping voltammograms of chromium in ground water (a) and
soil
b samples, using cupferron as a chelating agent.
a Curve a, response for electrolyte;
Curve b, same as a but after spiking 20 mL of the sample (500-fold dilution); curves c and d,
same as b, but after additions of 0.1 mgL 1 chromium; 20 s adsorption. (b) Curve a, response
for the electrolyte; curve b, same as a but after spiking 5 mL 1 of the soil extract (2000-fold
dilution); curves c and d, same as b but after additions of 0.5 mL 1 chromium; 15 s adsorption.
(Reproduced with permission from reference 43.)
conductivity, and capacitance can be monitored by various electrochemical detec-
tors, our discussion will focus primarily on the most popular constant-potential
measurements. Controlled-potential detectors are ideally suited for monitoring
analytes that are electroactive at modest potentials. Such devices are characterized
by a remarkable sensitivity (down to the picogram level), high selectivity (toward
electroactive species), wide linear range, low dead volumes, fast response, and
relatively simple and inexpensive instrumentation. Such detectors are commonly
used in many clinical, environmental, and industrial laboratories in connection with
automated ¯ow systems (e.g., ¯ow injection analyzers) or separation techniques
(particularly liquid chromatography and more recently capillary zone electrophoresis
and on-line microdialysis). Such coupling with advanced separation steps allows
electroanalysis to address highly complex samples.