
Page 102 - Analytical Electrochemistry 2d Ed - Jospeh Wang
P. 102
3-6 FLOW ANALYSIS 87
3-6.1 Principles
Electrochemical detection is usually performed by controlling the potential of the
working electrode at a ®xed value (corresponding to the limiting current plateau
region of the compounds of interest) and monitoring the current as a function of
time. The current response thus generated re¯ects the concentration pro®les of these
compounds as they pass through the detector. Detection for liquid chromatography
or ¯ow injection systems results in sharp current peaks (re¯ecting the passage of the
eluted analyte or sample zone, respectively). Accordingly, the magnitude of the peak
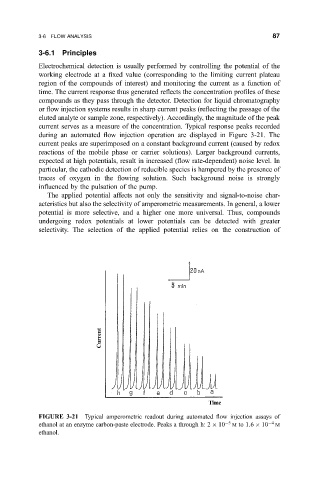
current serves as a measure of the concentration. Typical response peaks recorded
during an automated ¯ow injection operation are displayed in Figure 3-21. The
current peaks are superimposed on a constant background current (caused by redox
reactions of the mobile phase or carrier solutions). Larger background currents,
expected at high potentials, result in increased (¯ow rate-dependent) noise level. In
particular, the cathodic detection of reducible species is hampered by the presence of
traces of oxygen in the ¯owing solution. Such background noise is strongly
in¯uenced by the pulsation of the pump.
The applied potential affects not only the sensitivity and signal-to-noise char-
acteristics but also the selectivity of amperometric measurements. In general, a lower
potential is more selective, and a higher one more universal. Thus, compounds
undergoing redox potentials at lower potentials can be detected with greater
selectivity. The selection of the applied potential relies on the construction of
FIGURE 3-21 Typical amperometric readout during automated ¯ow injection assays of
ethanol at an enzyme carbon-paste electrode. Peaks a through h: 2 10 5 M to 1:6 10 4 M
ethanol.