
Page 286 - Applied Process Design For Chemical And Petrochemical Plants Volume III
P. 286
66131_Ludwig_CH10G 5/30/2001 4:40 PM Page 248
248 Applied Process Design for Chemical and Petrochemical Plants
The authors 227 point out that the emissivity, , for many For the solution, connect (t 1 t a ) 500 with Q 60 and
pipe surfaces ranges from 0.87–0.92 at approximately 70°F extend to cut line 1 (dashed lines) at A. Connect f 2.0 with
for highly polished aluminum, 0.23–0.28. point A and extend to cut line 2 at B. Connect B with K
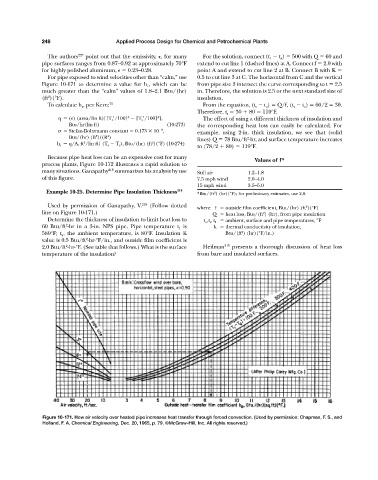
For pipe exposed to wind velocities other than “calm,” use 0.5 to cut line 3 at C. The horizontal from C and the vertical
Figure 10-171 to determine a value for h c , which can be from pipe size 3 intersect the curve corresponding to t 2.5
much greater than the “calm” values of 1.8–2.1 Btu/(hr) in. Therefore, the solution is 2.5 or the next standard size of
2
(ft )(°F). insulation.
To calculate h r , per Kern: 70 From the equation, (t s t a ) Q/f, (t s t a ) 60/2 30.
Therefore, t s 30 80 110°F.
4
4
q ( ) (area/lin ft)[[T s /100] [T s /100] ], The effect of using a different thickness of insulation and
Btu/hr(lin ft) (10-273) the corresponding heat loss can easily be calculated. For
8
Stefan-Boltzmann constant 0.173 10 , example, using 2-in. thick insulation, we see that (solid
4
2
Btu/(hr) (ft )((R ) lines) Q 78 Btu/ft -hr, and surface temperature increases
2
2
2
h r q/A, ft /lin ft) (T s T r ), Btu/(hr) (ft )(°F) (10-274)
to (78/2 80) 119°F.
Because pipe heat loss can be an expensive cost for many
Values of f*
process plants, Figure 10-172 illustrates a rapid solution to
many situations. Ganapathy 218 summarizes his analysis by use Still air 1.2–1.8
of this figure. 7.5 mph wind 2.0–4.0
15 mph wind 3.5–5.0
Example 10-25. Determine Pipe Insulation Thickness 218 *Btu/(ft ) (hr)(°F); for preliminary estimates, use 2.0.
2
Used by permission of Ganapathy, V. 218 (Follow dotted 2
where f outside film coefficient, Btu/(hr) (ft )(°F)
line on Figure 10-171.) Q heat loss, Btu/(ft ) (hr), from pipe insulation
2
Determine the thickness of insulation to limit heat loss to t a ,t s ,t 1 ambient, surface and pipe temperatures, °F
60 Btu/ft -hr in a 3-in. NPS pipe. Pipe temperature t 1 is k thermal conductivity of insulation,
2
580°F; t a , the ambient temperature, is 80°F. Insulation K Btu/(ft ) (hr)(°F/in.)
2
2
value is 0.5 Btu/ft -hr-°F/in., and outside film coefficient is
2
2.0 Btu/ft -hr-°F. (See table that follows.) What is the surface Heilman 219 presents a thorough discussion of heat loss
temperature of the insulation? from bare and insulated surfaces.
Figure 10-171. How air velocity over heated pipe increases heat transfer through forced convection. (Used by permission: Chapman, F. S., and
Holland, F. A. Chemical Engineering, Dec. 20, 1965, p. 79. ©McGraw-Hill, Inc. All rights reserved.)