
Page 230 - Applied Petroleum Geomechanics
P. 230
In situ stress estimate 225
130 ε h = 100
ε h = 0 ε h = 200 S
120
110 RF
(MPa) 100 SS
σ H 90 ν = 0.25
80 NF σ v
S Min. strain = 0 micro strains
70 Min. strain = 100 micro strains
Min. strain = 200 micro strains
60
60 70 80 90 100 110 120 130
σ (MPa)
h
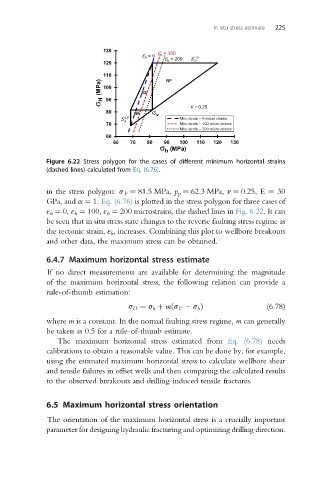
Figure 6.22 Stress polygon for the cases of different minimum horizontal strains
(dashed lines) calculated from Eq. (6.76).
in the stress polygon: s V ¼ 81.5 MPa, p p ¼ 62.3 MPa, n ¼ 0.25, E ¼ 30
GPa, and a ¼ 1. Eq. (6.76) is plotted in the stress polygon for three cases of
ε h ¼ 0, ε h ¼ 100, ε h ¼ 200 microstrains, the dashed lines in Fig. 6.22. It can
be seen that in situ stress state changes to the reverse faulting stress regime as
the tectonic strain, ε h , increases. Combining this plot to wellbore breakouts
and other data, the maximum stress can be obtained.
6.4.7 Maximum horizontal stress estimate
If no direct measurements are available for determining the magnitude
of the maximum horizontal stress, the following relation can provide a
rule-of-thumb estimation:
s H ¼ s h þ mðs V s h Þ (6.78)
where m is a constant. In the normal faulting stress regime, m can generally
be taken as 0.5 for a rule-of-thumb estimate.
The maximum horizontal stress estimated from Eq. (6.78) needs
calibrations to obtain a reasonable value. This can be done by, for example,
using the estimated maximum horizontal stress to calculate wellbore shear
and tensile failures in offset wells and then comparing the calculated results
to the observed breakouts and drilling-induced tensile fractures.
6.5 Maximum horizontal stress orientation
The orientation of the maximum horizontal stress is a crucially important
parameter for designing hydraulic fracturing and optimizing drilling direction.