
Page 133 - Applied Statistics And Probability For Engineers
P. 133
c04.qxd 5/10/02 5:19 PM Page 111 RK UL 6 RK UL 6:Desktop Folder:TEMP WORK:MONTGOMERY:REVISES UPLO D CH114 FIN L:Quark Files:
4-6 NORMAL DISTRIBUTION 111
f (x)
f (x)
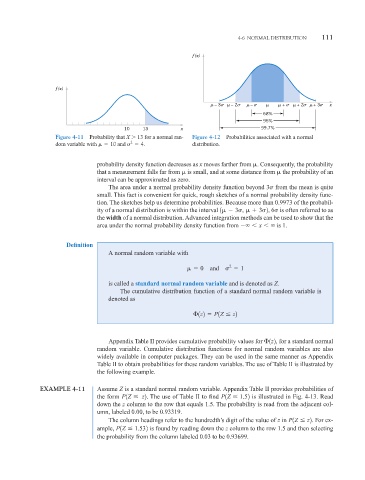
– 3 µ – 2 – + + 2 + 3 x
68%
95%
10 13 x 99.7%
Figure 4-11 Probability that X 13 for a normal ran- Figure 4-12 Probabilities associated with a normal
2
dom variable with 10 and 4. distribution.
probability density function decreases as x moves farther from . Consequently, the probability
that a measurement falls far from is small, and at some distance from the probability of an
interval can be approximated as zero.
The area under a normal probability density function beyond 3 from the mean is quite
small. This fact is convenient for quick, rough sketches of a normal probability density func-
tion. The sketches help us determine probabilities. Because more than 0.9973 of the probabil-
ity of a normal distribution is within the interval 1 3 ,
3 2 , 6 is often referred to as
the width of a normal distribution. Advanced integration methods can be used to show that the
area under the normal probability density function from x is 1.
Definition
A normal random variable with
2
0 and 1
is called a standard normal random variable and is denoted as Z.
The cumulative distribution function of a standard normal random variable is
denoted as
1z2 P1Z z2
Appendix Table II provides cumulative probability values for 1z2 , for a standard normal
random variable. Cumulative distribution functions for normal random variables are also
widely available in computer packages. They can be used in the same manner as Appendix
Table II to obtain probabilities for these random variables. The use of Table II is illustrated by
the following example.
EXAMPLE 4-11 Assume Z is a standard normal random variable. Appendix Table II provides probabilities of
the form P1Z z2. The use of Table II to find P1Z 1.52 is illustrated in Fig. 4-13. Read
down the z column to the row that equals 1.5. The probability is read from the adjacent col-
umn, labeled 0.00, to be 0.93319.
The column headings refer to the hundredth’s digit of the value of z in P1Z z2. For ex-
ample, P1Z 1.532 is found by reading down the z column to the row 1.5 and then selecting
the probability from the column labeled 0.03 to be 0.93699.