
Page 135 - Applied Statistics And Probability For Engineers
P. 135
c04.qxd 5/13/02 11:18 M Page 113 RK UL 6 RK UL 6:Desktop Folder:TEMP WORK:MONTGOMERY:REVISES UPLO D CH114 FIN L:Quark Files:
4-6 NORMAL DISTRIBUTION 113
(5) P1Z 4.62 cannot be found exactly from Appendix Table II. However, the last
entry in the table can be used to find that P1Z 3.992 0.00003 . Because
P1Z 4.62 P1Z 3.992, P1Z 4.62 is nearly zero.
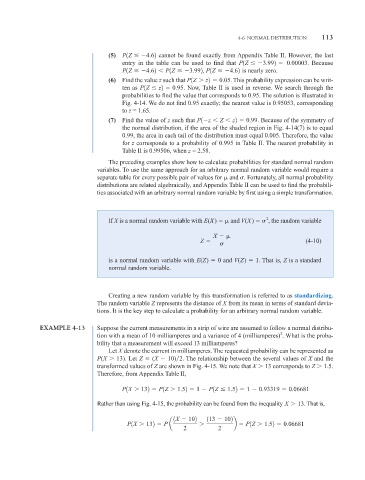
(6) Find the value z such that P1Z z2 0.05. This probability expression can be writ-
ten as P1Z z2 0.95 . Now, Table II is used in reverse. We search through the
probabilities to find the value that corresponds to 0.95. The solution is illustrated in
Fig. 4-14. We do not find 0.95 exactly; the nearest value is 0.95053, corresponding
to z = 1.65.
(7) Find the value of z such that P1 z Z z2 0.99 . Because of the symmetry of
the normal distribution, if the area of the shaded region in Fig. 4-14(7) is to equal
0.99, the area in each tail of the distribution must equal 0.005. Therefore, the value
for z corresponds to a probability of 0.995 in Table II. The nearest probability in
Table II is 0.99506, when z = 2.58.
The preceding examples show how to calculate probabilities for standard normal random
variables. To use the same approach for an arbitrary normal random variable would require a
separate table for every possible pair of values for and . Fortunately, all normal probability
distributions are related algebraically, and Appendix Table II can be used to find the probabili-
ties associated with an arbitrary normal random variable by first using a simple transformation.
2
If X is a normal random variable with E(X) and V(X) , the random variable
X
Z (4-10)
is a normal random variable with E(Z) 0 and V(Z) 1. That is, Z is a standard
normal random variable.
Creating a new random variable by this transformation is referred to as standardizing.
The random variable Z represents the distance of X from its mean in terms of standard devia-
tions. It is the key step to calculate a probability for an arbitrary normal random variable.
EXAMPLE 4-13 Suppose the current measurements in a strip of wire are assumed to follow a normal distribu-
2
tion with a mean of 10 milliamperes and a variance of 4 (milliamperes) . What is the proba-
bility that a measurement will exceed 13 milliamperes?
Let X denote the current in milliamperes. The requested probability can be represented as
P(X 13). Let Z (X 10) 2. The relationship between the several values of X and the
transformed values of Z are shown in Fig. 4-15. We note that X 13 corresponds to Z 1.5.
Therefore, from Appendix Table II,
P1X 132 P1Z 1.52 1 P1Z 1.52 1 0.93319 0.06681
Rather than using Fig. 4-15, the probability can be found from the inequality X 13. That is,
1X 10² 113 102
P1X 132 P a b P1Z 1.52 0.06681
2 2