
Page 137 - Applied Statistics And Probability For Engineers
P. 137
c04.qxd 5/10/02 5:19 PM Page 115 RK UL 6 RK UL 6:Desktop Folder:TEMP WORK:MONTGOMERY:REVISES UPLO D CH114 FIN L:Quark Files:
4-6 NORMAL DISTRIBUTION 115
x – 10
z = = 2.05
2
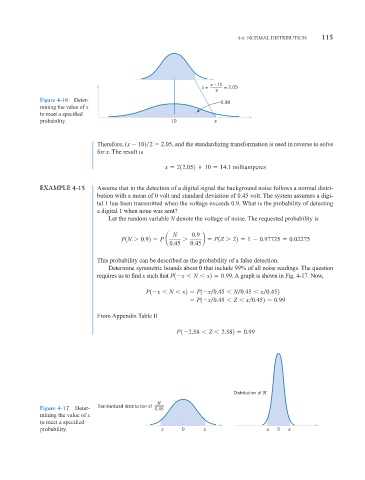
Figure 4-16 Deter-
0.98
mining the value of x
to meet a specified
probability. 10 x
Therefore, (x 10) 2 2.05, and the standardizing transformation is used in reverse to solve
for x. The result is
x 212.052
10 14.1 milliamperes
EXAMPLE 4-15 Assume that in the detection of a digital signal the background noise follows a normal distri-
bution with a mean of 0 volt and standard deviation of 0.45 volt. The system assumes a digi-
tal 1 has been transmitted when the voltage exceeds 0.9. What is the probability of detecting
a digital 1 when none was sent?
Let the random variable N denote the voltage of noise. The requested probability is
N 0.9
P1N 0.92 P a b P1Z 22 1 0.97725 0.02275
0.45 0.45
This probability can be described as the probability of a false detection.
Determine symmetric bounds about 0 that include 99% of all noise readings. The question
requires us to find x such that P1 x N x2 0.99 . A graph is shown in Fig. 4-17. Now,
P1 x N x2 P1 x 0.45 N 0.45 x 0.452
P1 x 0.45 Z x 0.452 0.99
From Appendix Table II
P 1 2.58 Z 2.582 0.99
Distribution of N
N
Figure 4-17 Deter- Standardized distribution of 0.45
mining the value of x
to meet a specified
probability. – z 0 z – x 0 x