
Page 133 - Applied Statistics Using SPSS, STATISTICA, MATLAB and R
P. 133
4.1 Hypothesis Test Procedure 113
Values of a normal random variable, standardised by subtracting the mean and
dividing by the standard deviation, are called z-scores. In this case, the test errors α
and β are evaluated using the z-score, −1.283.
In hypothesis tests, one is usually interested in that the probability of wrongly
rejecting the null hypothesis is low; in other words, one wants to set a low value
for the following Type I Error:
Type I Error: α = P(H 0 is true and, based on the test, we reject H 0).
This is the so-called level of significance of the test. The complement, 1–α, is
the confidence level. A popular value for the level of significance that we will use
throughout the book is α = 0.05, often given in percentage, α = 5%. Knowing the
α percentile of the standard normal distribution, one can easily determine the
decision threshold for this level of significance:
Z
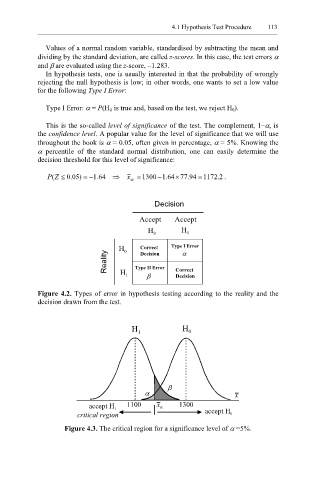
P ( ≤ . 0 05 ) = − . 1 64 ⇒ x α = 1300 − . 1 64× 77 . 94 = 1172 2 . .
Decision
Accept Accept
H 0 H 1
H 0 Correct Type I Error
α
Reality H Type II Error Correct
Decision
β
1
Decision
Figure 4.2. Types of error in hypothesis testing according to the reality and the
decision drawn from the test.
H 1 H 0
β
α x
accept H 1 1100 x α 1300
critical region accept H 0
Figure 4.3. The critical region for a significance level of α =5%.