
Page 136 - Applied Statistics Using SPSS, STATISTICA, MATLAB and R
P. 136
116 4 Parametric Tests of Hypotheses
shown above, are displayed in Table 4.1. The respective power curve, also called
operational characteristic of the test, is shown with a solid line in Figure 4.5. Note
that the power for the alternative hypothesis µ A = 1100 is somewhat higher than
80%. This is usually considered a lower limit of protection that one must have
against alternative hypothesis.
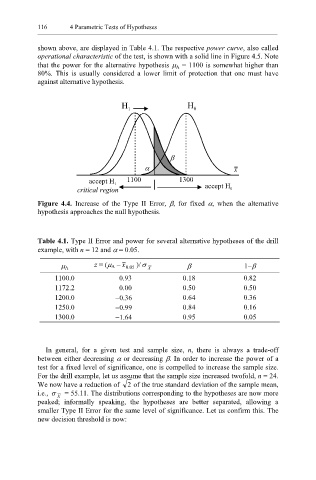
H 1 H 0
β
α x
accept H 1 1100 1300
critical region accept H 0
Figure 4.4. Increase of the Type II Error, β, for fixed α, when the alternative
hypothesis approaches the null hypothesis.
Table 4.1. Type II Error and power for several alternative hypotheses of the drill
example, with n = 12 and α = 0.05.
µ A z = (µ A − x . 0 05 )/σ β 1−β
X
1100.0 0.93 0.18 0.82
1172.2 0.00 0.50 0.50
1200.0 −0.36 0.64 0.36
1250.0 −0.99 0.84 0.16
1300.0 −1.64 0.95 0.05
In general, for a given test and sample size, n, there is always a trade-off
between either decreasing α or decreasing β. In order to increase the power of a
test for a fixed level of significance, one is compelled to increase the sample size.
For the drill example, let us assume that the sample size increased twofold, n = 24.
We now have a reduction of 2 of the true standard deviation of the sample mean,
i.e., σ = 55.11. The distributions corresponding to the hypotheses are now more
X
peaked; informally speaking, the hypotheses are better separated, allowing a
smaller Type II Error for the same level of significance. Let us confirm this. The
new decision threshold is now: