
Page 139 - Applied Statistics Using SPSS, STATISTICA, MATLAB and R
P. 139
4.2 Test Errors and Test Power 119
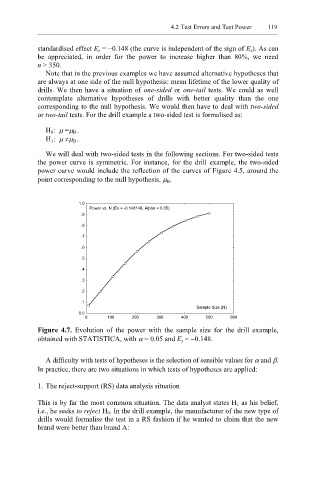
standardised effect E s = −0.148 (the curve is independent of the sign of E s). As can
be appreciated, in order for the power to increase higher than 80%, we need
n > 350.
Note that in the previous examples we have assumed alternative hypotheses that
are always at one side of the null hypothesis: mean lifetime of the lower quality of
drills. We then have a situation of one-sided or one-tail tests. We could as well
contemplate alternative hypotheses of drills with better quality than the one
corresponding to the null hypothesis. We would then have to deal with two-sided
or two-tail tests. For the drill example a two-sided test is formalised as:
H 0: µ =µ B .
H 1: µ ≠µ B .
We will deal with two-sided tests in the following sections. For two-sided tests
the power curve is symmetric. For instance, for the drill example, the two-sided
power curve would include the reflection of the curves of Figure 4.5, around the
point corresponding to the null hypothesis, µ B.
1.0
Power vs. N (Es = -0.148148, Alpha = 0.05)
.9
.8
.7
.6
.5
.4
.3
.2
.1
Sample Size (N)
0.0
0 100 200 300 400 500 600
Figure 4.7. Evolution of the power with the sample size for the drill example,
obtained with STATISTICA, with α = 0.05 and E s = −0.148.
A difficulty with tests of hypotheses is the selection of sensible values for α and β.
In practice, there are two situations in which tests of hypotheses are applied:
1. The reject-support (RS) data analysis situation
This is by far the most common situation. The data analyst states H 1 as his belief,
i.e., he seeks to reject H 0. In the drill example, the manufacturer of the new type of
drills would formalise the test in a RS fashion if he wanted to claim that the new
brand were better than brand A: