
Page 141 - Applied Statistics Using SPSS, STATISTICA, MATLAB and R
P. 141
4.3 Inference on One Population 121
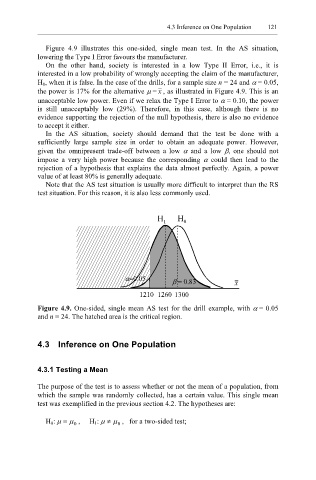
Figure 4.9 illustrates this one-sided, single mean test. In the AS situation,
lowering the Type I Error favours the manufacturer.
On the other hand, society is interested in a low Type II Error, i.e., it is
interested in a low probability of wrongly accepting the claim of the manufacturer,
H 0, when it is false. In the case of the drills, for a sample size n = 24 and α = 0.05,
the power is 17% for the alternative µ = x , as illustrated in Figure 4.9. This is an
unacceptable low power. Even if we relax the Type I Error to α = 0.10, the power
is still unacceptably low (29%). Therefore, in this case, although there is no
evidence supporting the rejection of the null hypothesis, there is also no evidence
to accept it either.
In the AS situation, society should demand that the test be done with a
sufficiently large sample size in order to obtain an adequate power. However,
given the omnipresent trade-off between a low α and a low β, one should not
impose a very high power because the corresponding α could then lead to the
rejection of a hypothesis that explains the data almost perfectly. Again, a power
value of at least 80% is generally adequate.
Note that the AS test situation is usually more difficult to interpret than the RS
test situation. For this reason, it is also less commonly used.
H 1 H 0
α=0.05 β = 0.83 x
1210 1260 1300
Figure 4.9. One-sided, single mean AS test for the drill example, with α = 0.05
and n = 24. The hatched area is the critical region.
4.3 Inference on One Population
4.3.1 Testing a Mean
The purpose of the test is to assess whether or not the mean of a population, from
which the sample was randomly collected, has a certain value. This single mean
test was exemplified in the previous section 4.2. The hypotheses are:
H 0: µ = µ , H 1: µ ≠ µ , for a two-sided test;
0
0