
Page 140 - Applied Statistics Using SPSS, STATISTICA, MATLAB and R
P. 140
120 4 Parametric Tests of Hypotheses
H 0: µ ≤ µ A =1100.
H 1: µ > µ A.
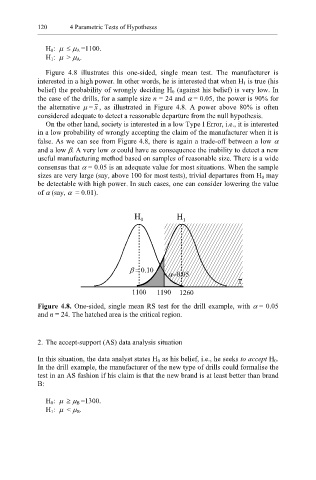
Figure 4.8 illustrates this one-sided, single mean test. The manufacturer is
interested in a high power. In other words, he is interested that when H 1 is true (his
belief) the probability of wrongly deciding H 0 (against his belief) is very low. In
the case of the drills, for a sample size n = 24 and α = 0.05, the power is 90% for
the alternative µ = x , as illustrated in Figure 4.8. A power above 80% is often
considered adequate to detect a reasonable departure from the null hypothesis.
On the other hand, society is interested in a low Type I Error, i.e., it is interested
in a low probability of wrongly accepting the claim of the manufacturer when it is
false. As we can see from Figure 4.8, there is again a trade-off between a low α
and a low β. A very low α could have as consequence the inability to detect a new
useful manufacturing method based on samples of reasonable size. There is a wide
consensus that α = 0.05 is an adequate value for most situations. When the sample
sizes are very large (say, above 100 for most tests), trivial departures from H 0 may
be detectable with high power. In such cases, one can consider lowering the value
of α (say, α = 0.01).
H 0 H 1
β = 0.10
α=0.05
x
1100 1190 1260
Figure 4.8. One-sided, single mean RS test for the drill example, with α = 0.05
and n = 24. The hatched area is the critical region.
2. The accept-support (AS) data analysis situation
In this situation, the data analyst states H 0 as his belief, i.e., he seeks to accept H 0.
In the drill example, the manufacturer of the new type of drills could formalise the
test in an AS fashion if his claim is that the new brand is at least better than brand
B:
H 0: µ ≥ µ B =1300.
H 1: µ < µ B.