
Page 160 - Applied Statistics Using SPSS, STATISTICA, MATLAB and R
P. 160
140 4 Parametric Tests of Hypotheses
Example 4.12
Q: Study the power of the tests performed in Example 4.11.
A: We use the STATISTICA Power Analysis module and the descriptive
statistics shown in Table 4.8.
For the pair T80-T81, the standardised effect is E s = (39.8−37.44)/2.059 =1.1
(see Table 4.7 and 4.8). It is, therefore, a large effect − justifying a high power of
the test.
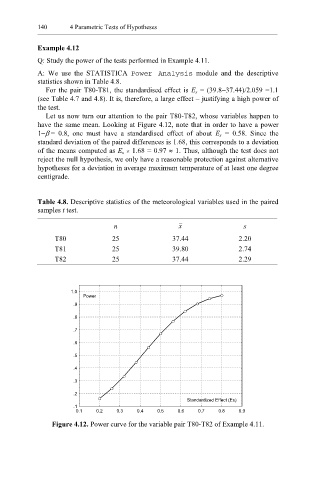
Let us now turn our attention to the pair T80-T82, whose variables happen to
have the same mean. Looking at Figure 4.12, note that in order to have a power
1−β = 0.8, one must have a standardised effect of about E s = 0.58. Since the
standard deviation of the paired differences is 1.68, this corresponds to a deviation
of the means computed as E s × 1.68 = 0.97 ≈ 1. Thus, although the test does not
reject the null hypothesis, we only have a reasonable protection against alternative
hypotheses for a deviation in average maximum temperature of at least one degree
centigrade.
Table 4.8. Descriptive statistics of the meteorological variables used in the paired
samples t test.
n x s
T80 25 37.44 2.20
T81 25 39.80 2.74
T82 25 37.44 2.29
1.0
Power
.9
.8
.7
.6
.5
.4
.3
.2
Standardized Effect (Es)
.1
0.1 0.2 0.3 0.4 0.5 0.6 0.7 0.8 0.9
Figure 4.12. Power curve for the variable pair T80-T82 of Example 4.11.