
Page 161 - Applied Statistics Using SPSS, STATISTICA, MATLAB and R
P. 161
4.5 Inference on More than Two Populations 141
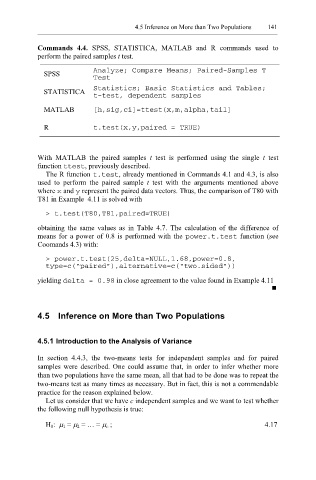
Commands 4.4. SPSS, STATISTICA, MATLAB and R commands used to
perform the paired samples t test.
SPSS Analyze; Compare Means; Paired-Samples T
Test
STATISTICA Statistics; Basic Statistics and Tables;
t-test, dependent samples
MATLAB [h,sig,ci]=ttest(x,m,alpha,tail]
R t.test(x,y,paired = TRUE)
With MATLAB the paired samples t test is performed using the single t test
function ttest , previously described.
The R function t.test , already mentioned in Commands 4.1 and 4.3, is also
used to perform the paired sample t test with the arguments mentioned above
where x and y represent the paired data vectors. Thus, the comparison of T80 with
T81 in Example 4.11 is solved with
> t.test(T80,T81,paired=TRUE)
obtaining the same values as in Table 4.7. The calculation of the difference of
means for a power of 0.8 is performed with the power.t.test function (see
Coomands 4.3) with:
> power.t.test(25,delta=NULL,1.68,power=0.8,
type=c(“paired”),alternative=c(“two.sided”))
yielding delt a = 0.98 in close agreement to the value found in Example 4.11
4.5 Inference on More than Two Populations
4.5.1 Introduction to the Analysis of Variance
In section 4.4.3, the two-means tests for independent samples and for paired
samples were described. One could assume that, in order to infer whether more
than two populations have the same mean, all that had to be done was to repeat the
two-means test as many times as necessary. But in fact, this is not a commendable
practice for the reason explained below.
Let us consider that we have c independent samples and we want to test whether
the following null hypothesis is true:
H 0: µ 1 = µ 2 = … = µ c ; 4.17