
Page 167 - Applied Statistics Using SPSS, STATISTICA, MATLAB and R
P. 167
4.5 Inference on More than Two Populations 147
A: We use the one-way ANOVA test for the variable ART, with c = 3. Note that
we can accept that the variable ART is normally distributed in the three classes
using specific tests to be explained in the following chapter. For the moment, the
reader has to rely on visual inspection of the normal fit curve to the histograms of
ART.
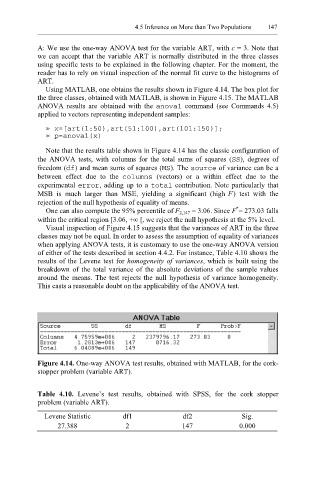
Using MATLAB, one obtains the results shown in Figure 4.14. The box plot for
the three classes, obtained with MATLAB, is shown in Figure 4.15. The MATLAB
ANOVA results are obtained with the anova1 command (see Commands 4.5)
applied to vectors representing independent samples:
» x=[art(1:50),art(51:100),art(101:150)];
» p=anova1(x)
Note that the results table shown in Figure 4.14 has the classic configuration of
the ANOVA tests, with columns for the total sums of squares (SS ), degrees of
freedom (df ) and mean sums of squares ( MS ). The sour ce of variance can be a
between effect due to the columns (vectors) or a within effect due to the
experimental error , adding up to a tot al contribution. Note particularly that
MSB is much larger than MSE, yielding a significant (high F) test with the
rejection of the null hypothesis of equality of means.
*
One can also compute the 95% percentile of F 2,147 = 3.06. Since F = 273.03 falls
within the critical region [3.06, +∞ [, we reject the null hypothesis at the 5% level.
Visual inspection of Figure 4.15 suggests that the variances of ART in the three
classes may not be equal. In order to assess the assumption of equality of variances
when applying ANOVA tests, it is customary to use the one-way ANOVA version
of either of the tests described in section 4.4.2. For instance, Table 4.10 shows the
results of the Levene test for homogeneity of variances, which is built using the
breakdown of the total variance of the absolute deviations of the sample values
around the means. The test rejects the null hypothesis of variance homogeneity.
This casts a reasonable doubt on the applicability of the ANOVA test.
Figure 4.14. One-way ANOVA test results, obtained with MATLAB, for the cork-
stopper problem (variable ART).
Table 4.10. Levene’s test results, obtained with SPSS, for the cork stopper
problem (variable ART).
Levene Statistic df1 df2 Sig.
27.388 2 147 0.000