
Page 172 - Applied Statistics Using SPSS, STATISTICA, MATLAB and R
P. 172
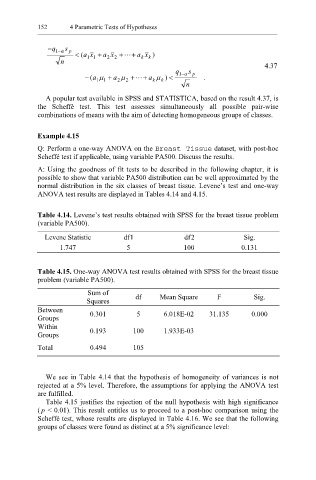
152      4 Parametric Tests of Hypotheses


              − q 1 α s  p  <  ( xa  +  a  +  a  x  )
                 −
                                 2
                  n      1  1  2  x +L  k  k                               4.37
                                                  q  s
                                                   −
                         − (a µ +  a µ +L + a µ k ) <  1 α  p  .
                                    2
                                           k
                            1
                              1
                                  2
                                                     n

              A popular test available in SPSS and STATISTICA, based on the result 4.37, is
           the Scheffé test. This test assesses  simultaneously all possible pair-wise
           combinations of means with the aim of detecting homogeneous groups of classes.

           Example 4.15
           Q: Perform a one-way ANOVA on the Breast Tissue   dataset, with post-hoc
           Scheffé test if applicable, using variable PA500. Discuss the results.
           A: Using the goodness of fit tests to be described in the following chapter, it is
           possible to show that variable PA500 distribution can be well approximated by the
           normal distribution in the six classes of breast tissue. Levene’s test and one-way
           ANOVA test results are displayed in Tables 4.14 and 4.15.

           Table 4.14. Levene’s test results obtained with SPSS for the breast tissue problem
           (variable PA500).
             Levene Statistic      df1              df2              Sig.
                  1.747             5               100             0.131

           Table 4.15. One-way ANOVA test results obtained with SPSS for the breast tissue
           problem (variable PA500).
                         Sum of        df    Mean Square     F          Sig.
                         Squares
           Between        0.301        5      6.018E-02    31.135      0.000
           Groups
           Within         0.193       100     1.933E-03
           Groups

           Total          0.494       105


              We see in Table 4.14 that the hypothesis of homogeneity of variances is not
           rejected at a 5% level. Therefore, the assumptions for applying the ANOVA test
           are fulfilled.
              Table 4.15 justifies the rejection of the null hypothesis with high significance
           ( p  <  0.01). This result entitles us to proceed to a post-hoc comparison using the
           Scheffé test, whose results are displayed in Table 4.16. We see that the following
           groups of classes were found as distinct at a 5% significance level: