
Page 175 - Applied Statistics Using SPSS, STATISTICA, MATLAB and R
P. 175
4.5 Inference on More than Two Populations 155
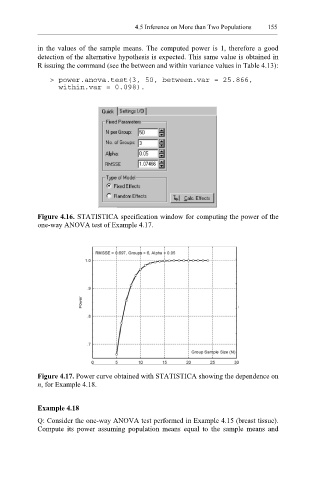
in the values of the sample means. The computed power is 1, therefore a good
detection of the alternative hypothesis is expected. This same value is obtained in
R issuing the command (see the between and within variance values in Table 4.13):
> power.anova.test(3, 50, between.var = 25.866,
within.var = 0.098).
Figure 4.16. STATISTICA specification window for computing the power of the
one-way ANOVA test of Example 4.17.
Figure 4.17. Power curve obtained with STATISTICA showing the dependence on
n, for Example 4.18.
Example 4.18
Q: Consider the one-way ANOVA test performed in Example 4.15 (breast tissue).
Compute its power assuming population means equal to the sample means and