
Page 179 - Applied Statistics Using SPSS, STATISTICA, MATLAB and R
P. 179
4.5 Inference on More than Two Populations 159
Sum of the squares representing the experimental error. The experimental
variance is v e = SSE/[rc(n – 1)], has rc(n – 1) degrees of freedom and is the
2
point estimate of σ .
6. SSI = SSS – (SSC + SSR) = SST – SSC – SSR – SSE.
The SSI term represents the influence on the experiment of the interaction
of the column and the row effects. The variance of the interaction,
v i = SSI/[(c – 1)(r – 1)] has (c – 1)(r – 1) degrees of freedom and is the point
2
2
estimate of σ + nσ .
I
Therefore, in the repeated measurements model, one can no longer treat
independently the column and row factors; usually, a term due to the interaction of
the columns with the rows has to be taken into account.
The ANOVA table for this experiment with additive and interaction effects is
shown in Table 4.20. The “Subtotal” row corresponds to the explained variance
”
due to both effects, Factor 1 and Factor 2, and their interaction. The Residual row
“
is the experimental error.
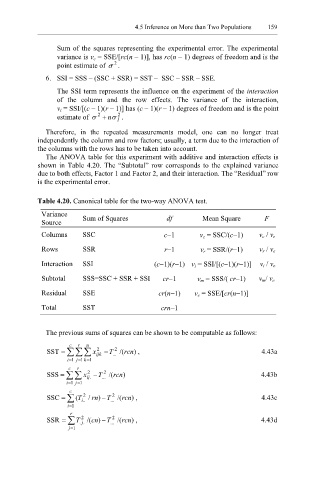
Table 4.20. Canonical table for the two-way ANOVA test.
Variance Sum of Squares df Mean Square F
Source
Columns SSC c−1 v c = SSC/(c−1) v c / v e
Rows SSR r−1 v r = SSR/(r−1) v r / v e
Interaction SSI (c−1)(r−1) v i = SSI/[(c−1)(r−1)] v i / v e
Subtotal SSS=SSC + SSR + SSI cr−1 v m = SSS/( cr−1) v m/ v e
Residual SSE cr(n−1) v e = SSE/[cr(n−1)]
Total SST crn−1
The previous sums of squares can be shown to be computable as follows:
c r n
2
2
SST = ∑∑∑ x ijk −T /( rcn) , 4.43a
...
= i 1 = j 1 = k 1
c r
2
2
SSS = ∑∑ x ij. −T /( rcn) 4.43b
...
= i 1 = j 1
c
2
2
SSC = ∑ ( T / rn) −T /( rcn) , 4.43c
...
i..
= i 1
r
2
2
SSR = ∑ T /( cn) −T /( rcn) , 4.43d
.
j.
...
= j 1